

Comparison of Evercode™ TCR Products Based on Version 3 vs Version 2 Chemistry in Primary Human T Cells
Key takeaways
- Higher TCR pairing efficiency and TCR transcript detection with Evercode TCR products based on v3 chemistry
- High correlation of TCR V gene frequencies between both chemistries, enabling a seamless transition to improved chemistry
Higher TCR pairing efficiency and TRA/TRB transcript detection provide researchers deeper biological insights from each experiment. To demonstrate the sensitivity improvements in the new Evercode TCR products based on v3 chemistry, its performance was evaluated against the Evercode TCR products on v2 chemistry using identical primary human T cell samples.
Experimental Design
Human primary T cells negatively selected from 4 PBMC donors were purchased from a commercial vendor. Vials were thawed in a 37༠C water bath, transferred to a 50 mL centrifuge tube, diluted dropwise with warm FBS-containing media, and centrifuged. All samples had a viability >90% after thawing.
Samples were fixed with Evercode Cell Fixation v3 kit and frozen at -80༠C.
Fixed samples were processed with the respective Evercode TCR kits based on v2 and v3 chemistry. For each kit, one 10,000 cell sublibrary was processed. The two sublibraries were sequenced with an Illumina Nextseq1000 High Output flow cell.
After demultiplexing, sequencing data was processed with Parse Biosciences data analysis pipeline 1.3.0. The analysis included results from sublibraries of Evercode TCR based on v2 and v3 chemistries, comprising 9,016 and 9,989 cells, respectively. Data was integrated with Seurat v5, filtered to remove doublets and low quality cells, cell types classified with Azimuth, and annotations finalized manually.
Higher TCR Pairing Efficiency and Transcript Sensitivity
Evercode TCR based on v3 chemistry detected more paired TCR chains and median TRA and TRB transcripts than the v2 chemistry (Figures 1-2). Further, Evercode TCR based on v3 chemistry detected 100% more median TRA transcripts and 33% more median TRB transcripts at 8,000 reads/cell. TCR pairing efficiency increased by 6% for the same primary human T cell sample between two kits. This data demonstrates that Evercode TCR on v3 chemistry offers improved performance as both TCR pairing efficiency and the number of TCR transcripts are higher than the ones obtained with v2 chemistry.
Figure 1: Comparison of Combined TRA and TRB Transcript Counts in Evercode TCR Products Based on Version 3 vs Version 2 Chemistry in Primary Human T Cells. For each kit, a 10,000 cell sublibrary was sequenced, and transcript detection at 8,000 reads/cell sequencing depth is shown.
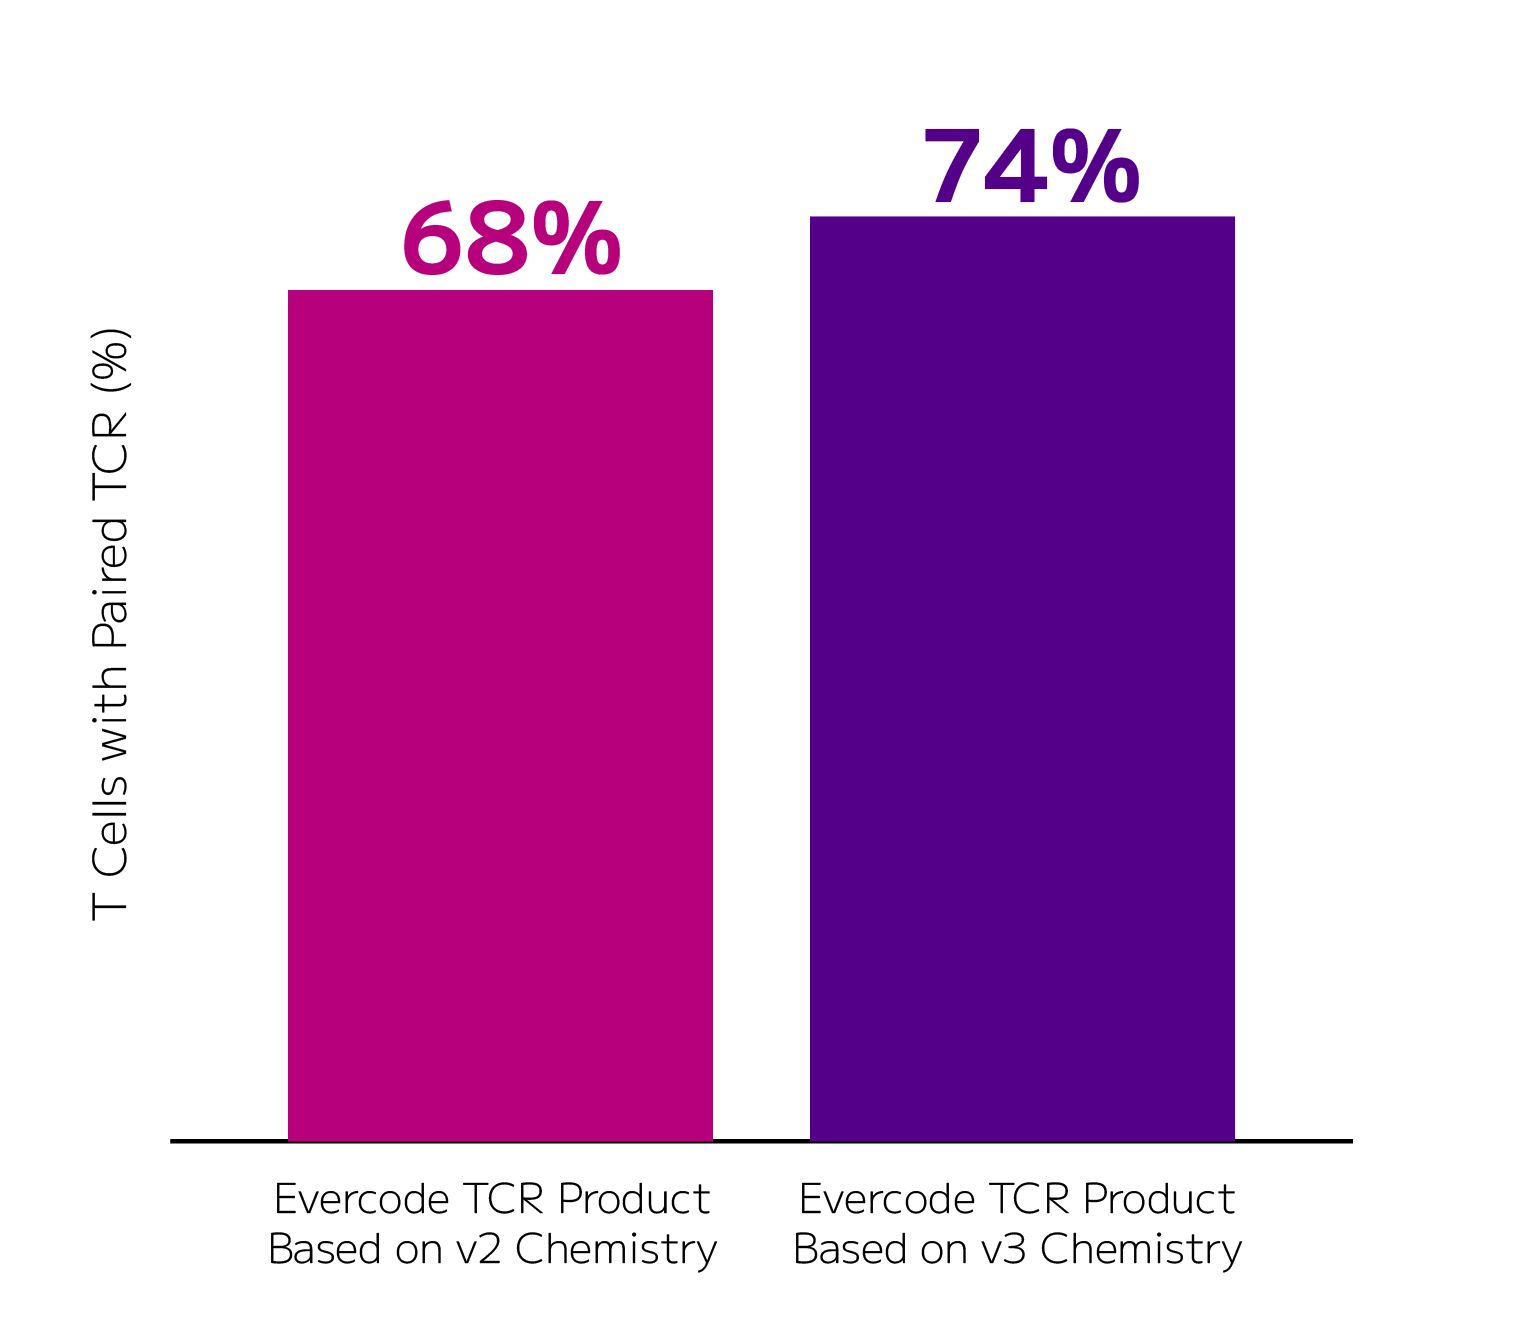
Figure 2: TCR Pairing Efficiency Comparison of Evercode TCR Products Based on Version 3 vs Version 2 Chemistry in Primary Human T Cells. For each kit, a 10,000 cell sublibrary was sequenced, and TCR pairing efficiency at 8,000 reads/cell sequencing depth is shown.
Improved Performance Without Compromises
TCR V gene frequencies were highly correlated between Evercode TCR products based on version 3 vs version 2 chemistry (r2=0.996 & 0.999, Figure 3). Similarly, the data is well integrated, consistently recovering equivalent cell type proportions (Figures 4-5). Consequently, researchers can switch to the Evercode TCR product based on v3 chemistry solution without complicating analysis of previous data.
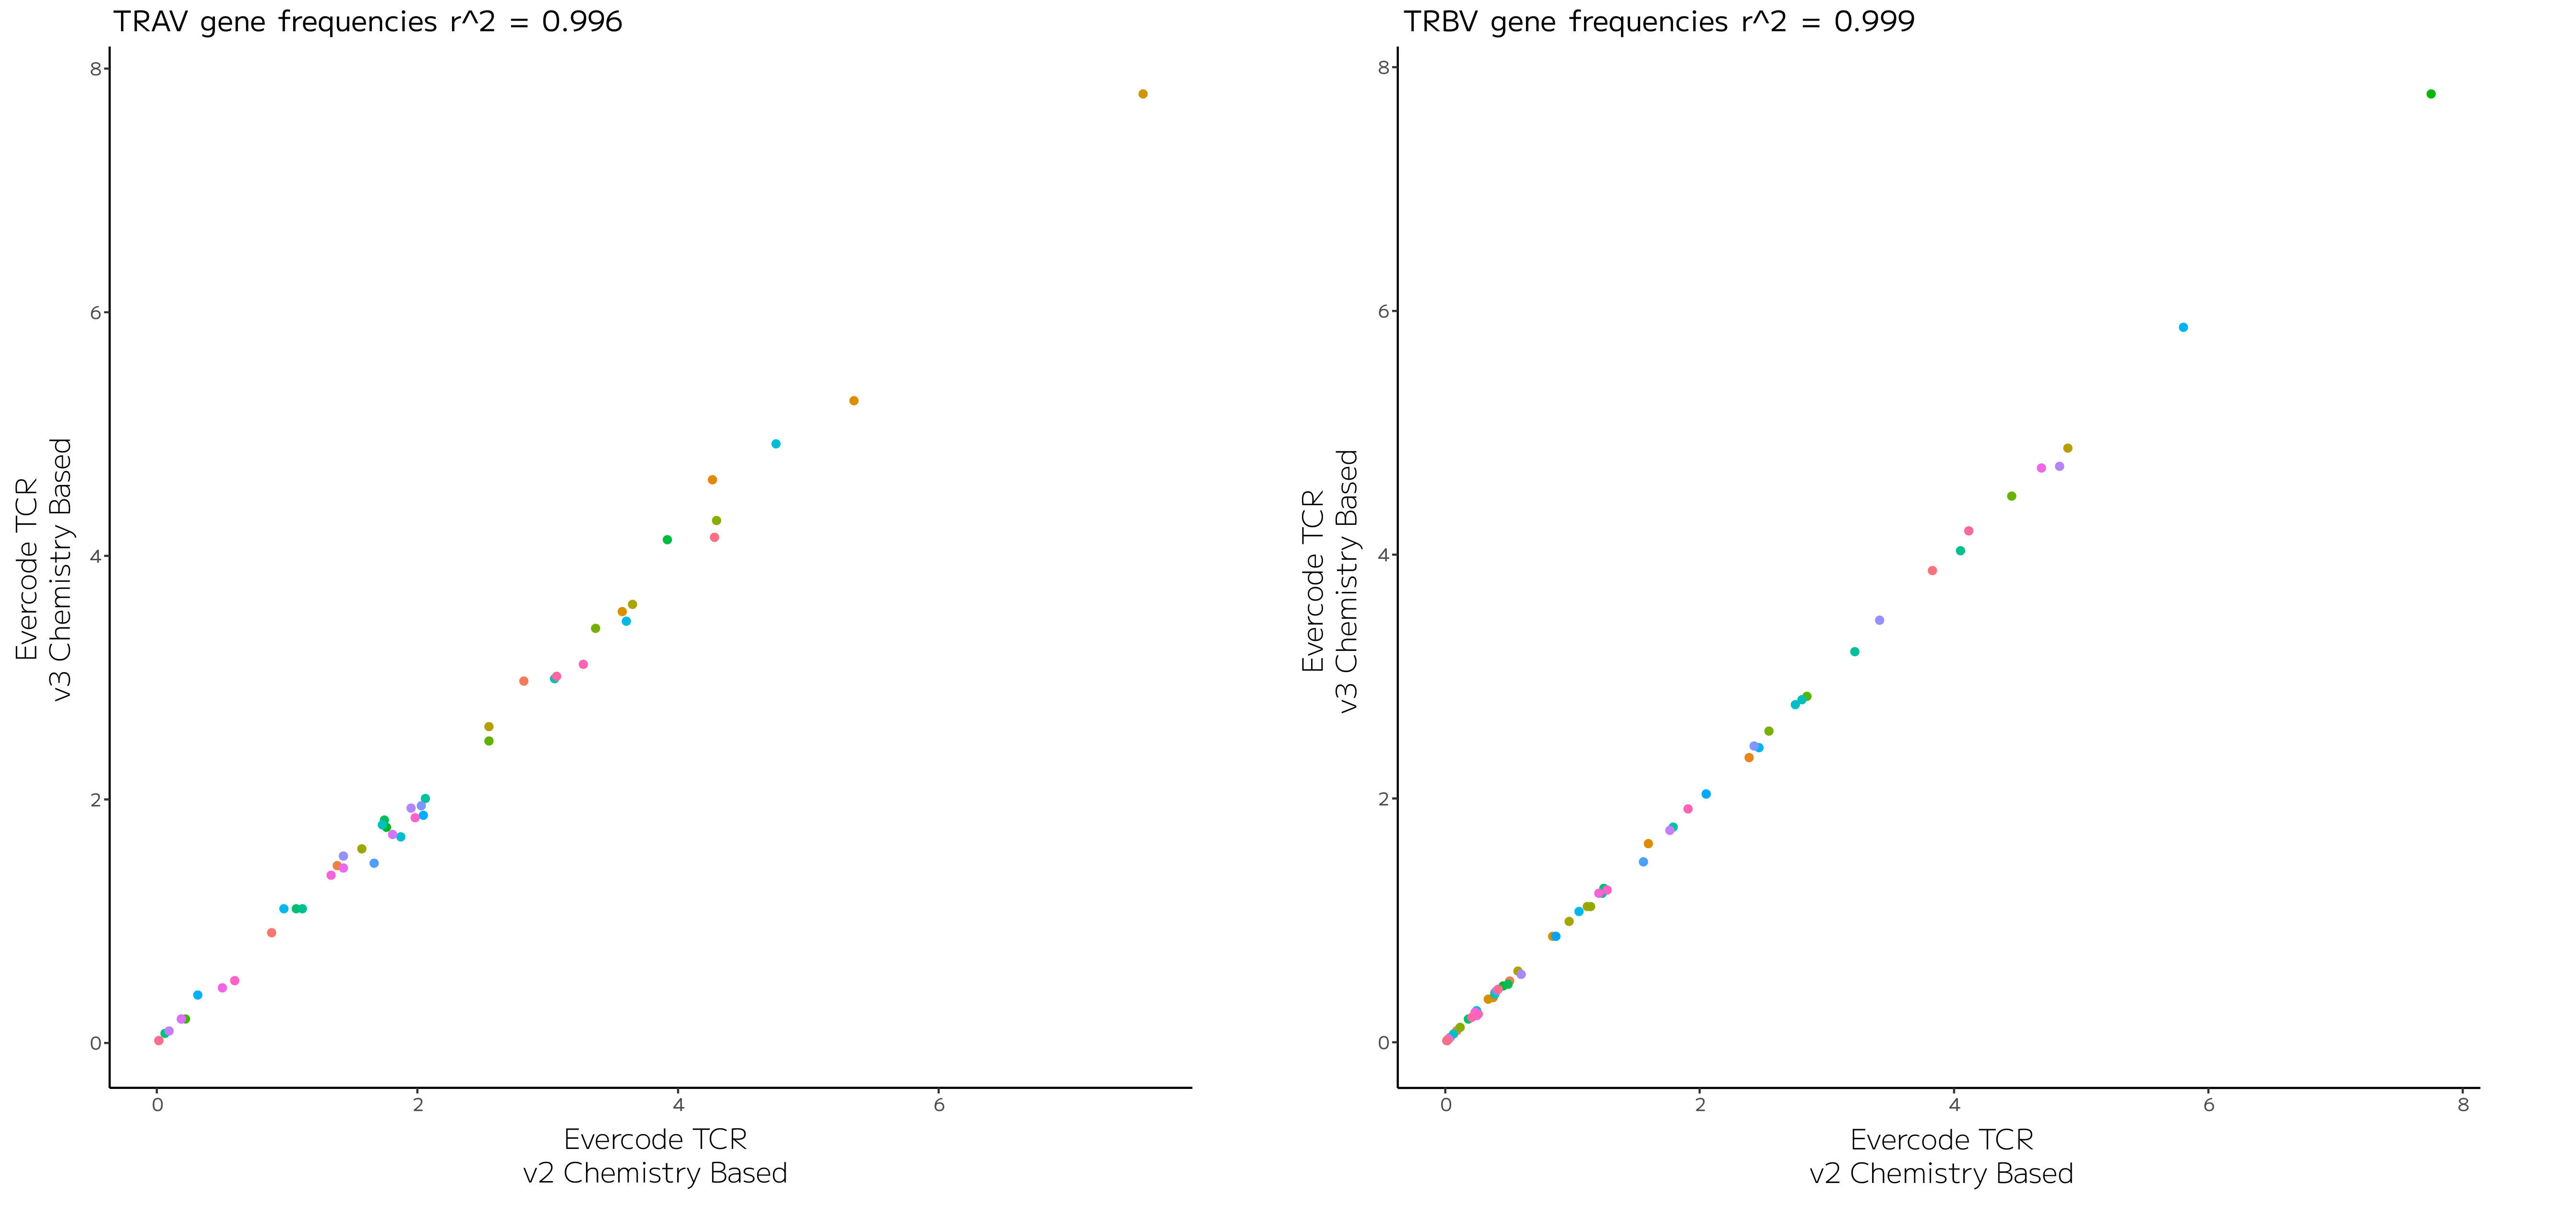
Figure 3: TCR V Gene Frequencies are Highly Correlated. Fraction of cells with a particular Variable (V) gene is plotted for all 4 donors. Each color on a data point represents a different V gene.
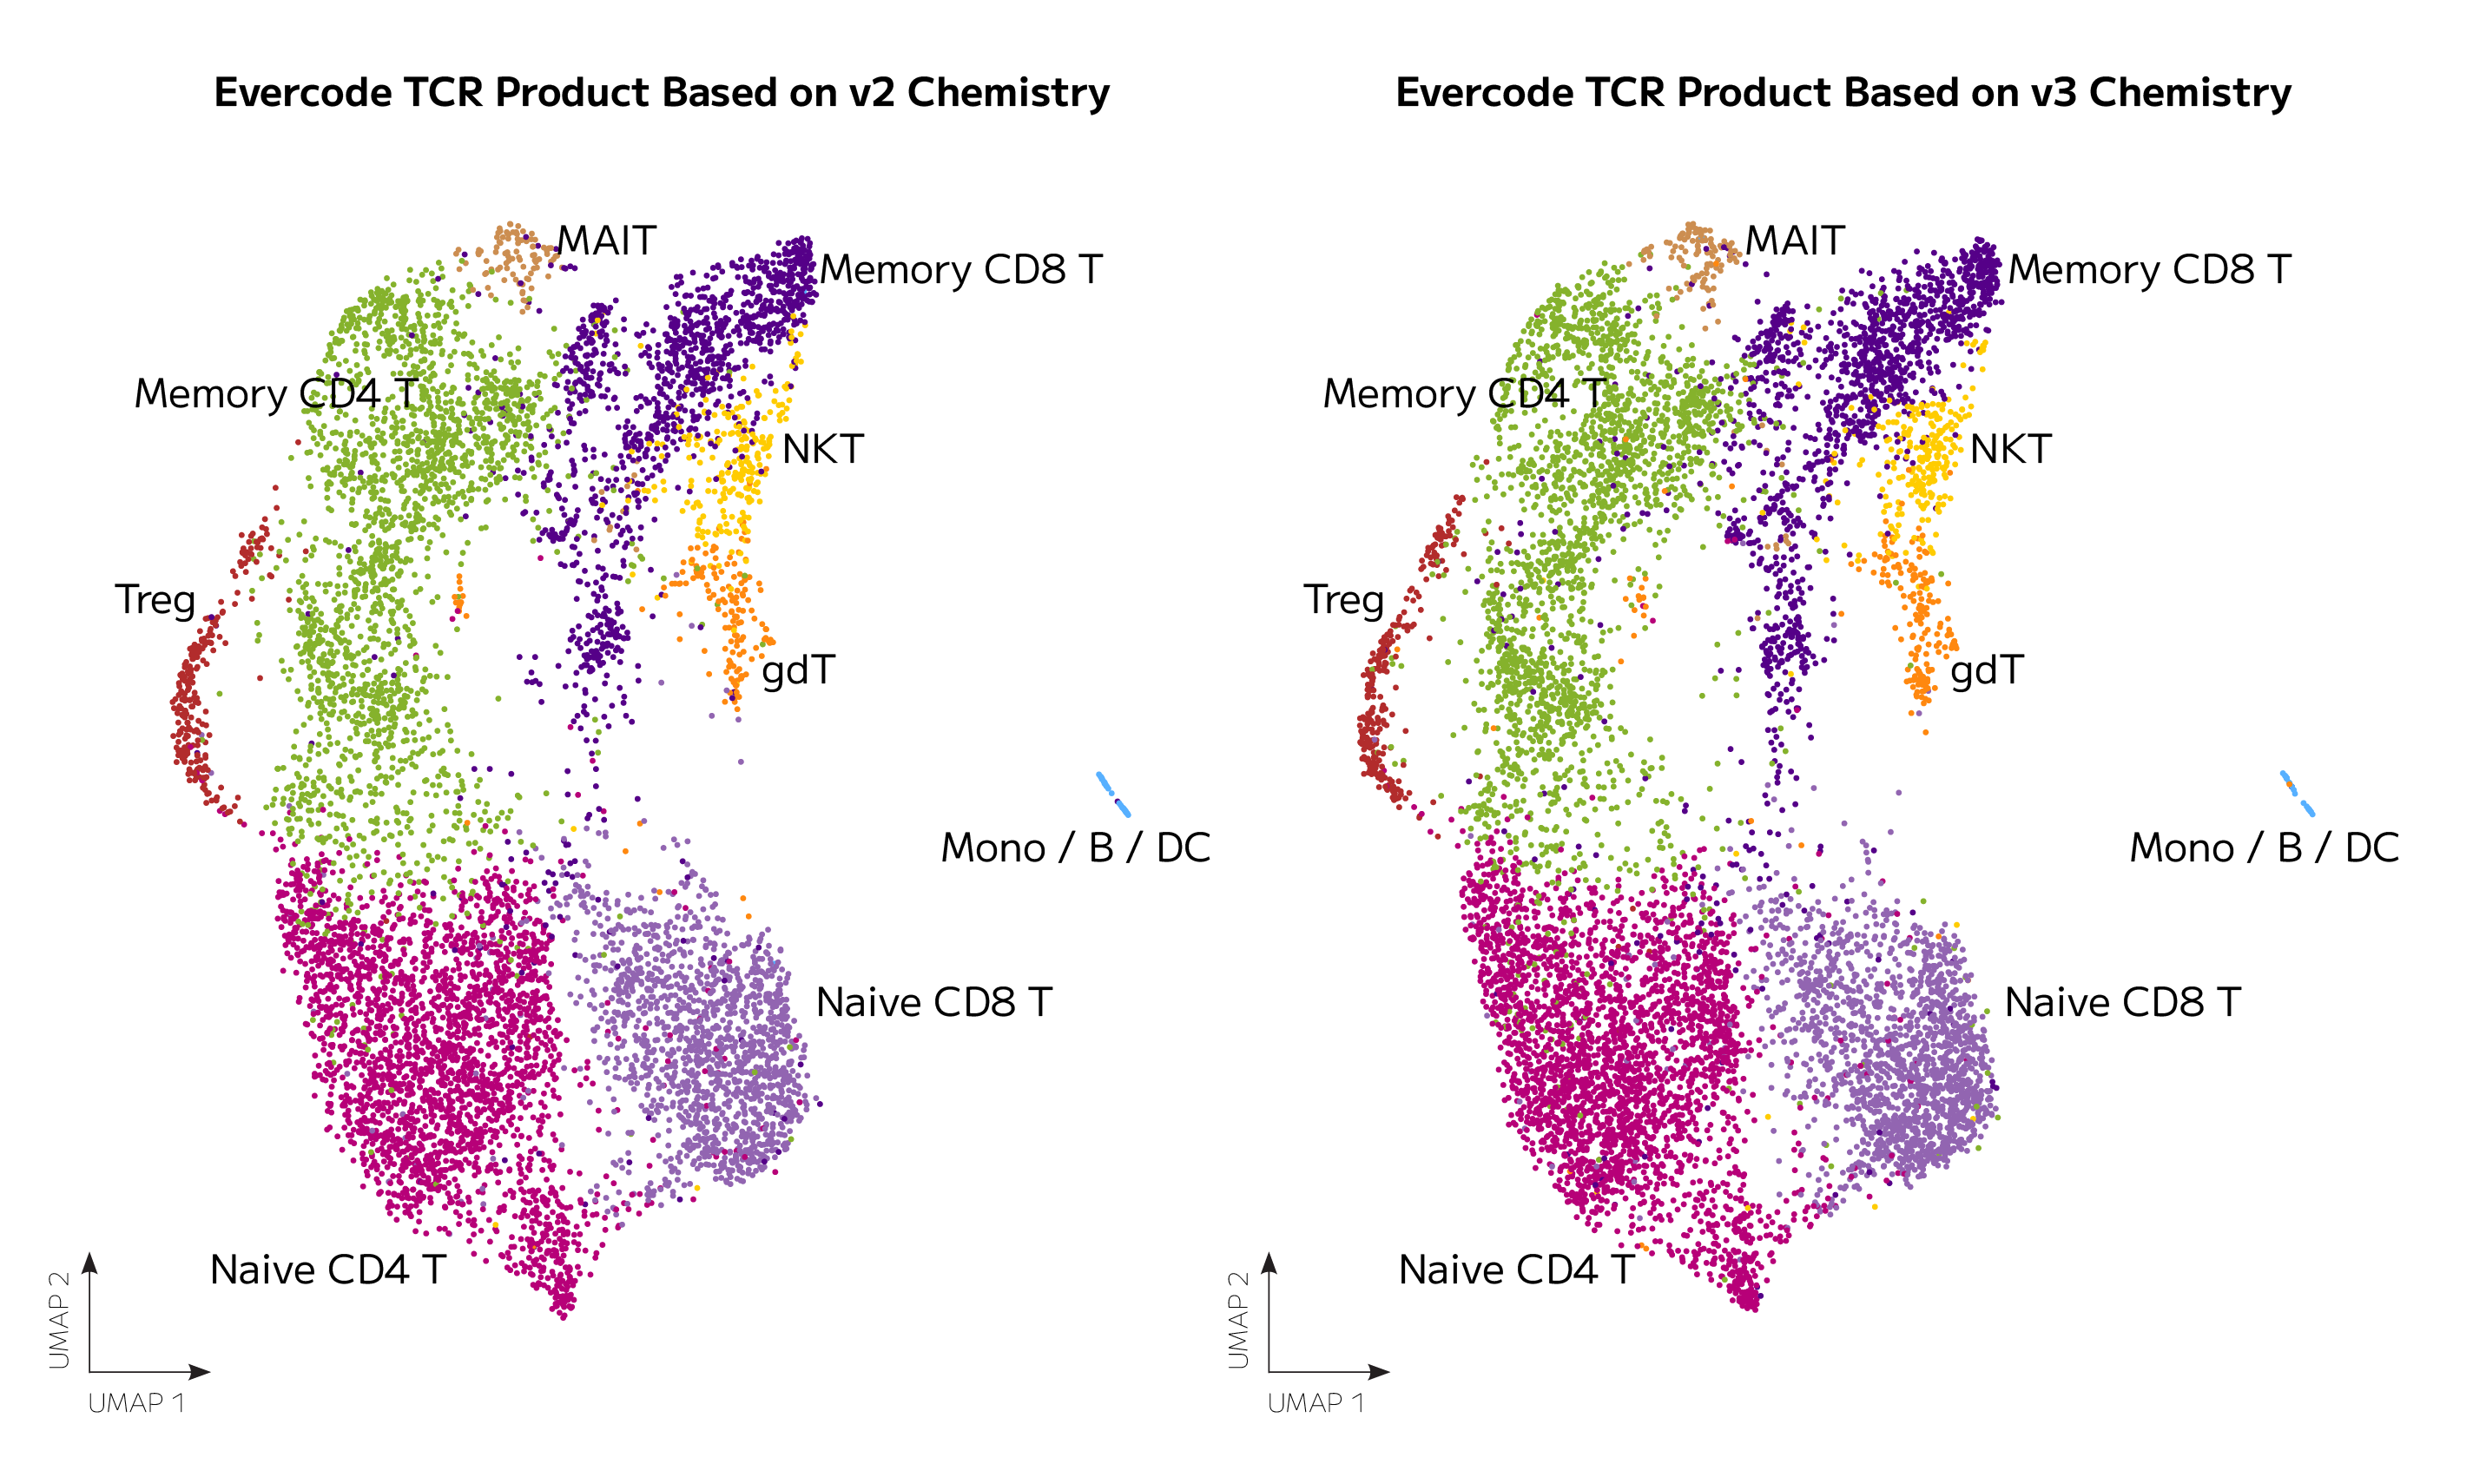
Figure 4. Clustering Is Highly Similar for Evercode TCR Products Based on Version 3 and Version 2 Chemistry. UMAP clusters of 9,016 and 9,989 and primary human T cells are shown for Evercode TCR products based on v2 and v3 based chemistry respectively after Seurat integration.
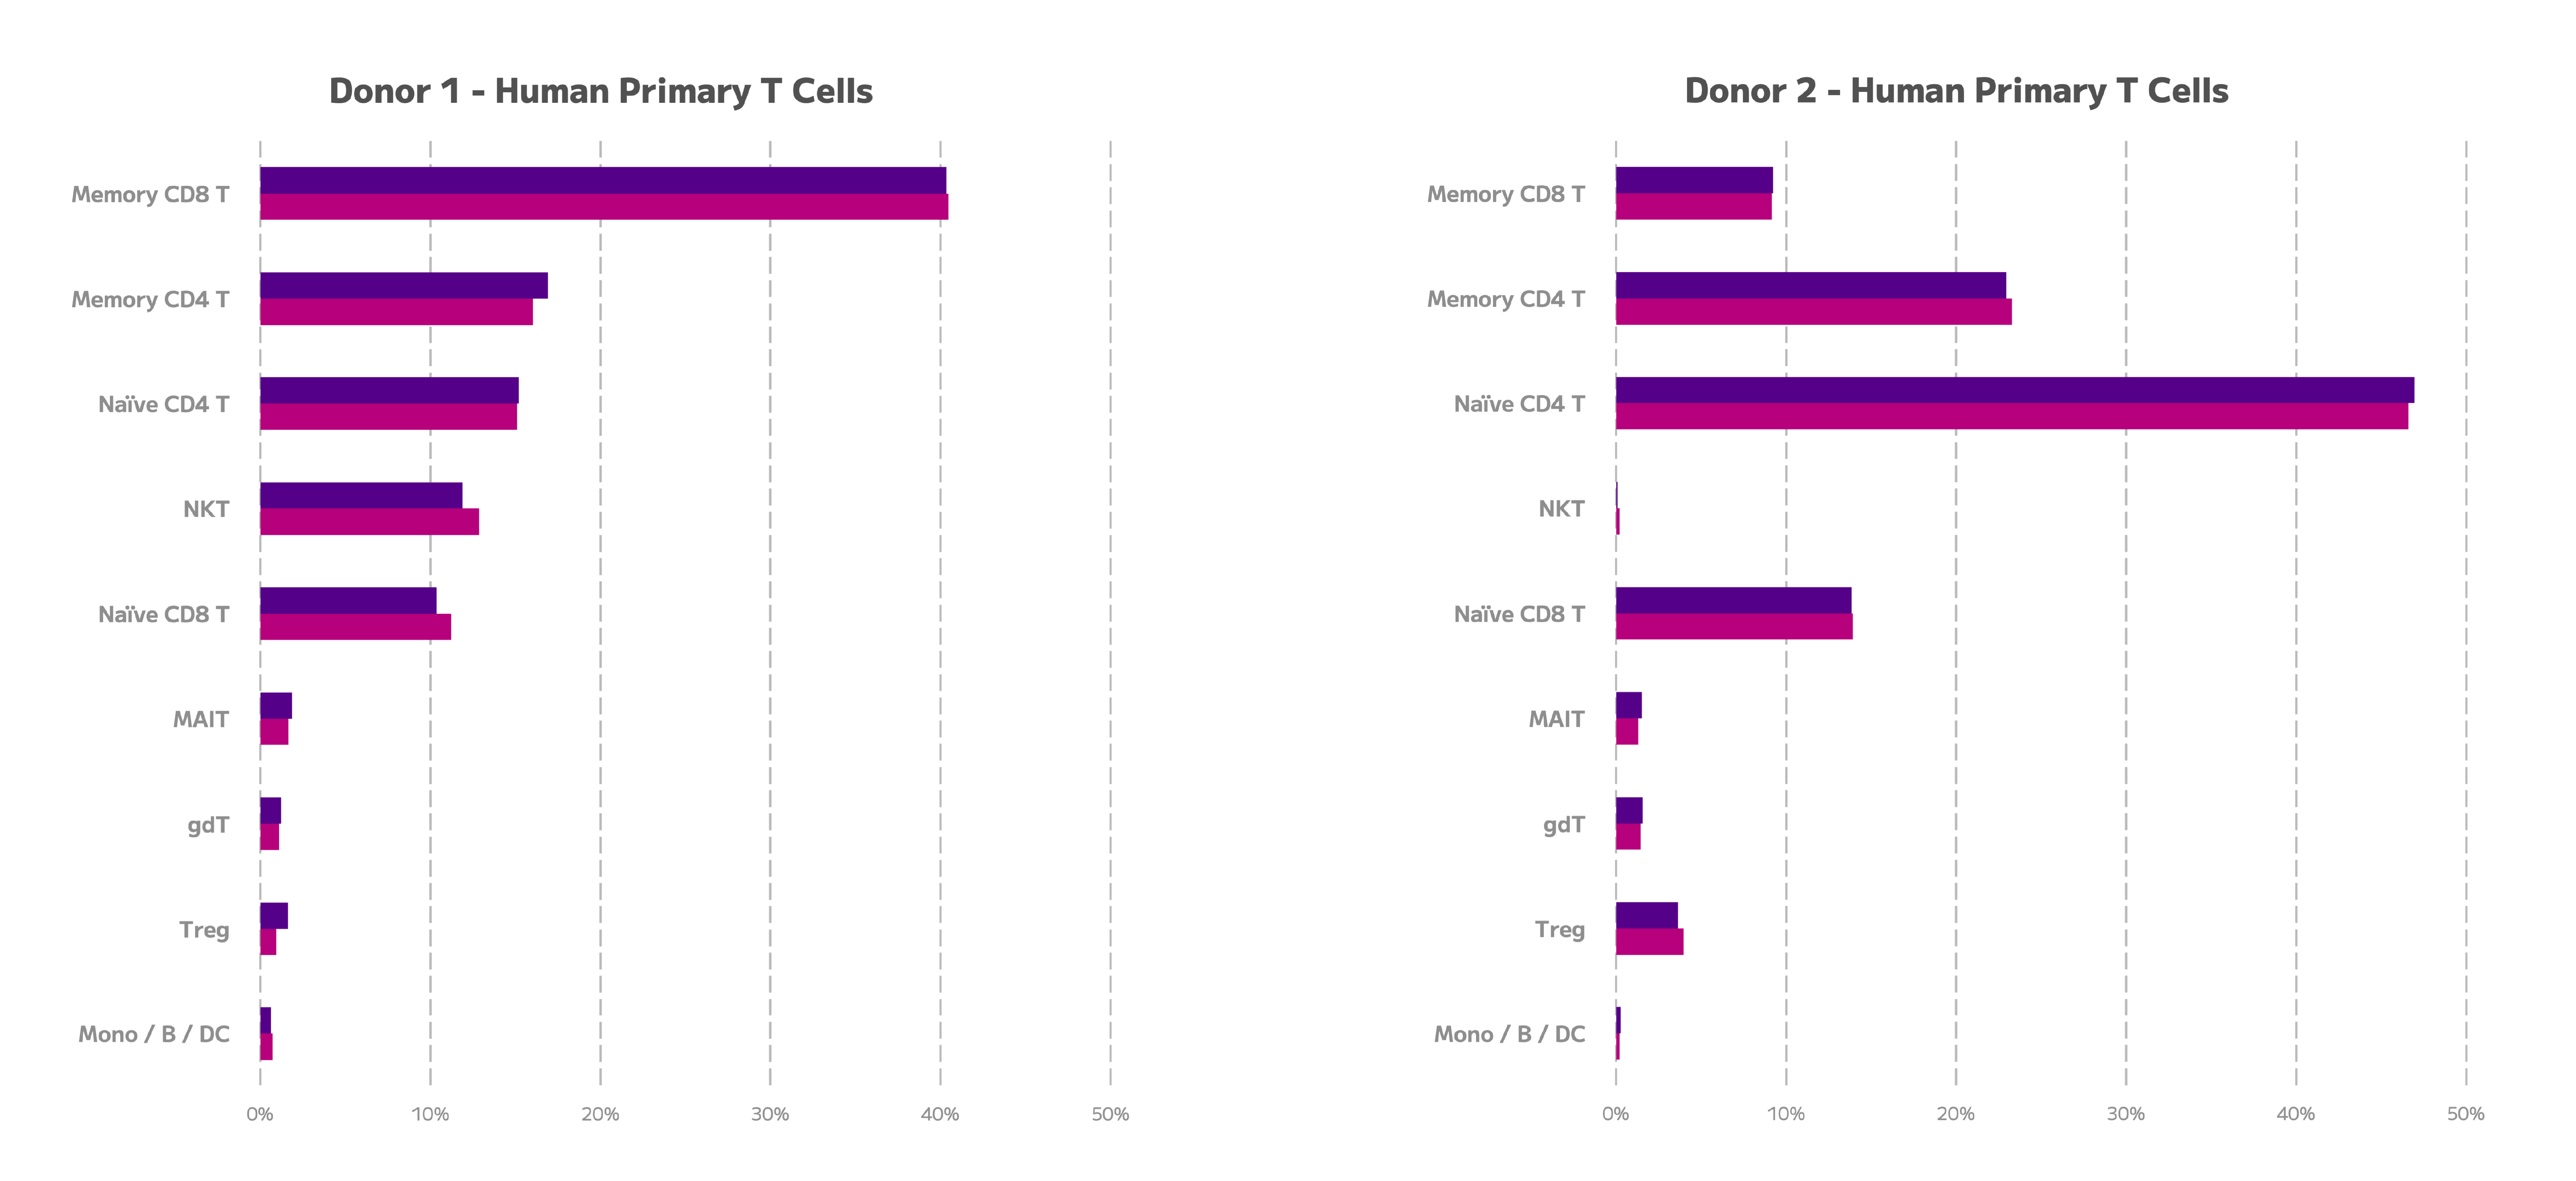
Figure 5. Comparison of Cell Type Proportions for Evercode TCR Products Based on Version 3 and Version 2 Chemistry. For two donors, cell type proportions are shown for Evercode TCR product based on v2 chemistry in pink and Evercode TCR product based on v3 chemistry in purple color.
Next Steps
- Download the data files generated from processing primary human T cell samples with Evercode TCR products based on v2 chemistry and v3 chemistry (below).
- Review a more comprehensive description of Evercode TCR in the Evercode TCR Technical Brochure.
- Visit the Evercode TCR product page for Evercode TCR product highlights.
Downloads
We're your partners in single cell
Reach out for a quote or for help planning your next experiment.