Whether you are just beginning with single cell RNA sequencing data analysis or you’re experienced in data analysis, getting the most out of your data matters because there is always more to discover.
Trailmaker is a modular and user-friendly analysis tool, designed to support a wide range of single-cell RNA-seq analysis needs. Users can enter or exit the workflow at multiple points, making it adaptable to both end-to-end users and those who want to continue using their established pipelines.
In the previous article we described how Trailmaker handles the various steps of the analysis workflow. Here, we present some common scenarios that users might come across while analyzing single cell data, and we provide some tips on how to handle those scenarios so that users can fully utilize their dataset.
Trailmaker has two modules. The Pipeline module delivers count matrices and summaries, while the Insight module—designed to be technology-agnostic—lets you dive deeper into the results. Importantly, each module has multiple entry and exit points so that one or both modules can be easily incorporated into your existing data analysis workflow.
For instance, users can begin with raw data (FASTQ files) and use the pipeline module to generate quality metrics (summary reports) and count matrices. The user can then either continue the analysis on Trailmaker using the Insights module or download the pipeline output data (including count matrices), exit Trailmaker and analyze the data with other tools, such as Seurat or Scanpy.
Alternatively, already processed data produced with any scRNA–seq platform can be imported directly into the Insight Module and explored. Trailmaker supports a wide range of file formats, including count matrices, Seurat objects, and H5 files, so it’s easy to integrate with most common single-cell data types/formats (Figure 1).
Figure 1: Trailmaker’s flexible workflow incorporates multiple entry and exit points.
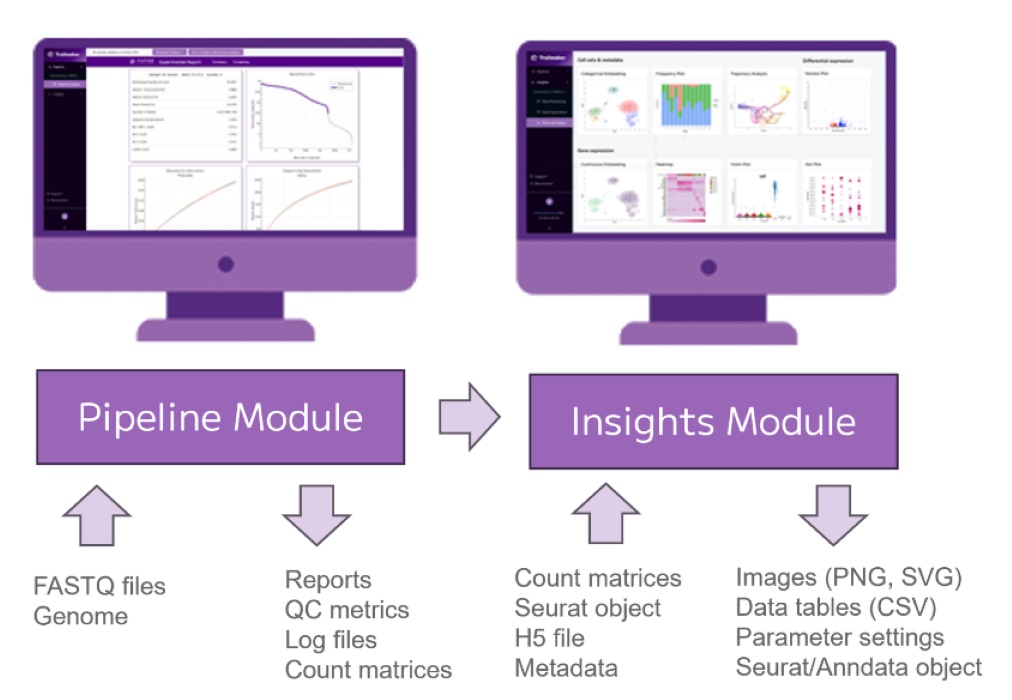
In the data processing page of Trailmaker Insights module, automatic filtering thresholds are initially set for all datasets. These automatic thresholds can be manually adjusted to tailor them to your experimental design and preferences.
Here are some examples when manual adjustments to filtering should be considered.
Filter 3 within the Data Processing page of Trailmaker Insights module removes dead cells based on the proportion of mitochondrial transcripts. A high-quality nuclei sample should have little to no mitochondrial transcripts, but incomplete cytoplasm removal may lead to mitochondrial transcript presence. When working with cells, tissues with high energy demands such as heart tissue, will have a higher number of mitochondria than other cells due to increased cellular respiration. In both cases the default threshold of 3 median absolute deviations may not be the most appropriate filtering strategy.
Filter 4 within the Data Processing page of Trailmaker Insights module removes outliers based on the correlation between number of genes and transcripts. Plotting the number of transcripts versus the number of genes on a logarithmic scale can reveal different cell populations. If a cell population is separated from the main population and has lower genes/transcript expression it is important to understand what these outliers are and decide if they should be eliminated or retained in downstream analysis.
Figure 2 shows a clear population of outliers in a PBMC dataset. They are red blood cells, therefore they can be removed. But they could be a legitimate population like neutrophils, in which case they should be retained for further analysis.
A good strategy for exploring any outlier populations is to disable the filter, reprocess the data and observe where these cells cluster.
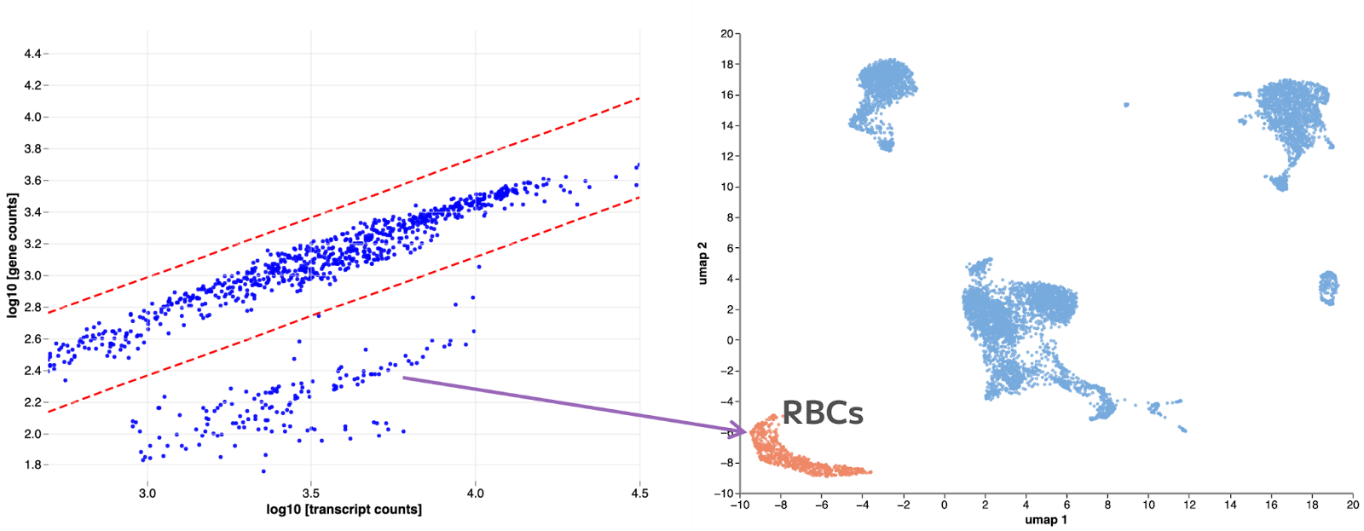
Figure 2: In this example, the population of cells with lower genes and transcripts turns out to be red blood cells, which you might choose to exclude from the downstream analysis.
Filter 5 within the Data Processing page of Trailmaker Insights module removes doublets and multiplets from the dataset by simulating artificial doublet profiles using cells from different clusters. It then scores the expression profiles of barcodes in the dataset against the simulated doublet profiles. An important factor to consider in the doublet score calculation is the number of cells in each sample, which dictates the power of the calculation. The reliability of doublet scoring improves with a large number of cells per sample, as the algorithm has sufficient power to better distinguish between singlets and doublets.
When the number of cells per sample is low (e.g., <500), the distribution of doublet scores becomes noisy and more dispersed. In this case, it may not be appropriate to use the default automatic filter setting, and you might consider setting a more appropriate filtering threshold manually, for example by comparing the thresholds across samples where you would expect the doublet rate to be similar.
Subsetting a specific cluster or cluster of interest allows you to “zoom in” on a particular area of the UMAP, which can reveal hidden biology.
In this example of a dataset containing over 1 million cells from a mouse eye atlas, it is possible to dive deeper into the retinal ganglion population. Subsetting this cluster can expose hidden heterogeneity previously masked in the full dataset (Figure 3).
Figure 3: Subsetting the retinal ganglion population (encircled lavender cluster in UMAP on the left) within this mouse eye dataset into a new analysis reveals many distinct sub-populations (UMAP on the right).
Annotation can be automated on Trailmaker; however, it is strongly recommended that you perform your own sanity check to ensure that the annotations applied correctly reflect the cell types present. This can be done using the Batch Differential Expression Table option in ‘Plots and Tables’ to calculate lists of marker genes, or by visualizing known markers of your cell types of interest in UMAPs, heatmaps or dot plots. Additionally, any cluster of interest can be subsetted into a new project to zoom into specific cell populations.
The platform’s cell set tools enable users to define and manipulate clusters. Through the Cell Sets and Metadata tab in Data Exploration, users can subset, combine, intersect, or exclude clusters to create customized groupings tailored to their experimental focus. These functions enable users to annotate cell types to a level of granularity that makes sense for their experimental design and research question.
Trailmaker is an intuitive, cloud-based platform that offers a complete end-to-end solution for single cell RNA sequencing analysis. Whether you’re new to scRNA-seq or looking to deepen your expertise, explore our data analysis webinars, take the free Mastering Single Cell RNA-seq Data Analysis course, or start analyzing your own data with Trailmaker.