Single cell RNA sequencing (scRNA-seq) data analysis can be intimidating to wet-lab scientists who are not trained in bioinformatics.
To simplify the process and eliminate the need for coding or powerful local computing infrastructure, we offer Trailmaker: a cloud-based, one-stop solution for data analysis, taking researchers through FASTQ file processing to generate insights without having to write a single line of code.
In this article, we will walk you through how Trailmaker streamlines the analysis process, how it helps scientists to uncover insights faster and ultimately lets them focus more on biology.
But before we get into Trailmaker, let’s quickly go through what a standard Single cell RNA seq data analysis workflow would look like.
Regardless of the method used to generate single-cell data, the analysis follows a series of typical steps that transition from raw sequencing output to biologically driven insights.
FASTQ files store raw sequence data and quality information from the sequencing experiment that, first, needs to be converted into count matrices.
Tools like FASTQC or MultiQC can be used to check the quality of the sequencing run. These tools use metrics like per base sequencing quality to visualize the average quality of base calls in each position of the reads.
Once quality control has been completed, the analysis proceeds with alignment and mapping to a reference genome to identify the origin of each read within the transcriptome. The resulting mapped reads are then used to generate a count matrix, which summarizes the number of transcripts (or UMIs) corresponding to each gene across all cells.
After generating gene count matrices, the next steps are data pre-processing and visualization.
Data pre-processing involves various filters and checks to remove low quality cells or barcodes that might affect the biological insights, as well as batch effect correction, normalization and dimensionality reduction.
Background: signals that do not originate from a cell
Background removal is the process of identifying and eliminating signals that don’t originate from the cells, such as ambient RNA, free-floating RNA molecules that can get barcoded and sequenced. As they show up as barcodes with a very low transcript number, they can be removed by setting a minimum number of transcripts per barcode.
High background can also be caused by dead and dying cells, whose compromised membrane can leak transcripts. This is less likely to occur with mitochondrial RNA as they are protected by the double membrane of mitochondria. As a result, mitochondrial RNA will increase relative to the total number of reads in dying or damaged cells. Dead and dying cells are typically excluded from downstream analysis by filtering out barcodes with high mitochondrial content.
Dead cells release RNA, and often contain a high proportion of mitochondrial RNA
In addition to excluding dead cells, it’s necessary to exclude doublets and multiplets from the analysis. These are essentially two or more cells that contain the same barcode combination and are therefore identified as a single unique cell. The scRNA-seq technology used can impact doublet rate. With combinatorial barcoding technology, doublets are a less likely event than in droplet-based technologies, due to the abundance of barcode combinations available.
Doublets: two cells with the same barcode combination make it impossible to identify which transcripts originated from which cell.
Data integration removes any batch effects in the experimental data. With the combinatorial barcoding approach on fixed cells or nuclei, batch effects are minimized as all samples from a single study or time course experiment can be processed together in a single run.
Data normalization is performed as part of the integration process, to normalize the feature expression measurements for each cell by total expression and then multiply this by a scale factor before log transforming the results. This makes the gene expression data comparable across different cells, samples, and/or tissues.
In the final step of processing single cell data, the large and complex dataset undergoes dimensionality reduction, typically using principal component analysis (PCA), in order to condense the data and prepare it for visualization in a 2-dimensional embedding plot.
Uniform Manifold Approximation and Projection (UMAP) or t-SNE plots are examples of embeddings that visualize the results of the principal component analysis in two dimensions. Once the data has undergone dimensionality reduction, clustering is then applied to group similar cells together.
Once the data has been pre-processed, a range of analyses can be applied to explore the data and derive meaningful biological insights. Things like differential gene expression, cell type annotation, pathway analysis, trajectory or pseudotime analysis, and visualizing gene expression patterns are some such examples.
Trailmaker consists of two major modules that are designed to guide users through the single cell data analysis workflow.
The Pipeline Module is dedicated to processing FASTQ files that are generated using Parse’s Evercode Whole Transcriptome technology.
The Insights Module then performs the downstream analysis and visualization of count matrices. As this module is technology-agnostic it allows multiple data import options (Figure 1).
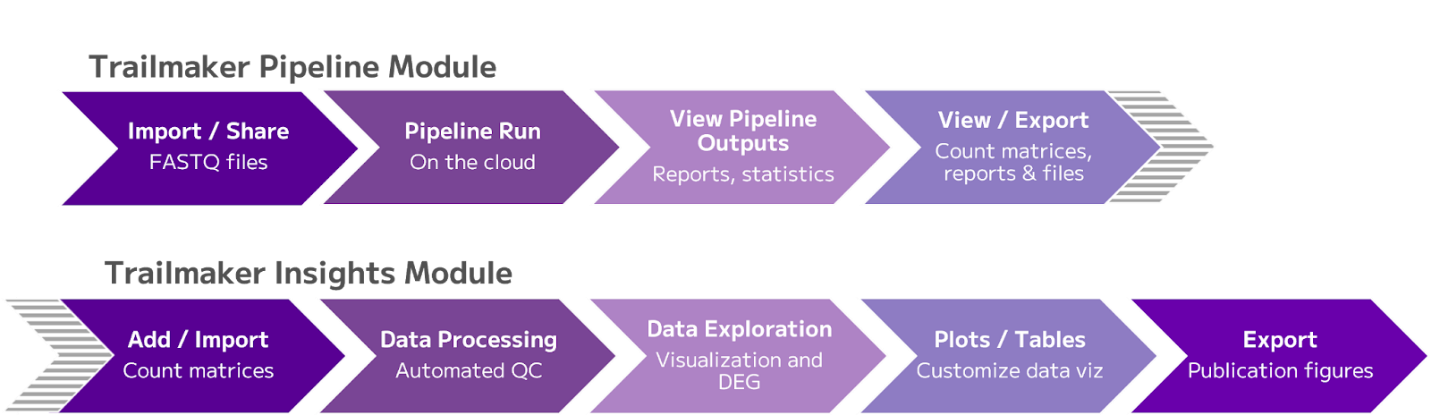
Figure 1: End-to-end data processing in Trailmaker, from FASTQ files to downstream data analysis of gene count matrices
Set up a new pipeline run in Trailmaker
The user begins by creating a new run, which opens a step-by-step wizard to guide through the setup process, including input of experimental design details such as Evercode kit type, chemistry version, and the number of sublibraries.
Next, the user uploads the sample loading table—an Excel file that contains the sample loading layout in the first barcoding plate, followed by the selection of the appropriate reference genome, and lastly upload of the FASTQ files.
The runtime of the pipeline run will depend on the project complexity. Therefore, the number of cells and sequencing depth will impact the timing, which can take a few hours when processing a few tens of thousands of cells, to up to 24+ hours when processing millions of cells.
Post-Run outputs and data downloads
Upon completion, the pipeline provides HTML summary reports including statistics like estimated cell counts, median transcript and genes per cell and sequencing quality metrics.
The downloadable data include unfiltered and filtered gene count matrices, pipeline log files, HTML summary reports, as well as intermediate files in the pipeline run including BAM files.
After completion of the pipeline, Trailmaker automatically sets up a project in the Insights module using the unfiltered gene count matrices. A “Go to Insights downstream analysis” button sends the user to the Insight Module project for downstream analysis.
Insight Module
The Insights Module includes three parts – Data processing, Data exploration, and Plots and Tables.
Data Processing
Trailmaker automatically applies a seven-step data processing pipeline that performs all the necessary filtering, integration, normalization and dimensionality reduction steps. The methods and parameters can be adjusted to the user’s preferences.
Filters 1-5 include the removal of background in the classifier and cell size distribution filters, the removal of dead cells based on mitochondrial content, the removal of poor quality cells in the genes-versus-transcripts filter, and doublet removal. Each filter offers manual override options to adjust thresholds and enable/disable filters, allowing customization based on sample characteristics and biology.
The last two steps are data integration—using methods like Harmony, Seurat or Fast MNN—and embedding configuration, where users generate UMAP or t-SNE plots and select clustering algorithms and cluster resolution settings. Normalization and dimensionality reduction also take place during these steps.
The user can then visualize UMAPs, with options to display different samples, metadata, or gene expression profiles.
To annotate the cell types represented by the clusters, users can run an automatic annotation using ScType by selecting tissue and species. If the automatic annotation is incomplete or unavailable, manual annotation using differential expression and marker gene identification tools is supported.
Differential expression analysis allows comparison between samples/ metadata groups within specific cell types, which can provide biological insight into the dataset. The results can be sorted, filtered for significance, and visualized using heatmaps. Significant genes identified through this process can be exported for pathway analysis directly within the platform.
The Plots and Tables Module offers a variety of visualization tools for exploring and presenting the data. All plots available in this module can be fully customized using the sidebar menus to adjust the data/metadata/clusters shown, plot axes, scaling, margins, titles, markers and color schemes to tailor figures for publication.
The types of plots available include:
Once finalized, plots can be downloaded as high-resolution images.
Trailmaker is a flexible platform that enables wet-lab scientists to control their own analysis and streamline the process from data production to publication. The automated and user-friendly aspects of the platform also allows bioinformaticians to speed up their data analysis journey while encouraging collaboration.
The platform also supports a single cell technology-agnostic entry point for downstream analysis, as the Insights Module data import options enable users to take full advantage of Trailmaker’s analysis and visualization features even without running the Pipeline Module.
Users can create a new Insights project by uploading existing count matrices, regardless of whether they were generated using Parse, other scRNA-seq technologies, and upload processed data in the form of a Seurat object.
Learn more about Trailmaker: https://www.parsebiosciences.com/data-analysis/
Analyze data with Trailmaker: https://app.trailmaker.parsebiosciences.com/landing