

Comparison of Evercode™ WT v3 and Evercode™ WT v2 in Human Immune Cells (PBMCs)
Key takeaways
- More gene and transcript detection with Evercode WT v3
- High correlation of gene expression between Evercode WT v2 and Evercode WT v3
Higher gene and transcript detection provides researchers deeper biological insights from each experiment. To demonstrate the sensitivity improvements in the new Evercode WT v3 kit, its performance was evaluated against the Evercode WT v2 kit using identical PBMC samples.
Experimental Design
Cryopreserved PBMCs from 4 donors were purchased from a commercial vendor. Vials were thawed in a 37༠C water bath, transferred to a 50 mL centrifuge tube, diluted dropwise with warm FBS media,centrifuged, and washed with cold FBS. All samples had a viability >90% after thawing.
Samples were fixed with Evercode Cell Fixation v2 and Evercode Cell Fixation v3 kits and frozen at -80༠C.
Fixed samples were processed with the respective Evercode WT v2 and Evercode WT v3 kit. For each kit, 4 sublibraries were loaded with 12,500 and 1 sublibrary with 2,000 cells. The smaller sublibraries were sequenced with an Illumina Nextseq550 High Output flow cell, and the larger sublibraries were sequenced with an Illumina Novaseq 6000 on 1 lane of a Novaseq S4 flow cell.
After demultiplexing, sequencing data was processed with Parse Biosciences data analysis pipeline v1.2.0. Results from all 4 sublibraries were analyzed from Evercode WT v2 and Evercode WT v3, for a total of 49,428 cells and 37,699, respectively. Data for combined 4 sublibraries was downsampled to an average of 40,000 reads/cell, integrated with Seurat, filtered to remove low quality cells, cell types classified with Azimuth, and annotations finalized manually. Data for one sublibrary with 2,000 cells from each kit was used to generate transcript and gene sensitivity plots at deeper sequencing reads.
Higher Gene and Transcript Sensitivity
Evercode WT v3 detected more genes and transcripts than Evercode WT v2 across a range of sequencing depths (Figures 1-2). Evercode WT v3 detected 90% more transcripts and 34% more genes at 100,000 reads/cell. At a lower sequencing depth of 20,000 reads/cell, Evercode WT v3 detected 24% more transcripts and 10% more genes. This data also demonstrates that Evercode WT v3 libraries offer increased complexity, showcasing improved performance as neither gene nor transcript detection reaching saturation even at 100,000 reads/cell.
Figure 1: Transcript Detection Comparison of Evercode WT v2 and Evercode WT v3 in Human PBMCs. For each kit, a 2,000 cell sublibrary was sequenced deeply, and transcript detection across a range of sequencing depths is shown.
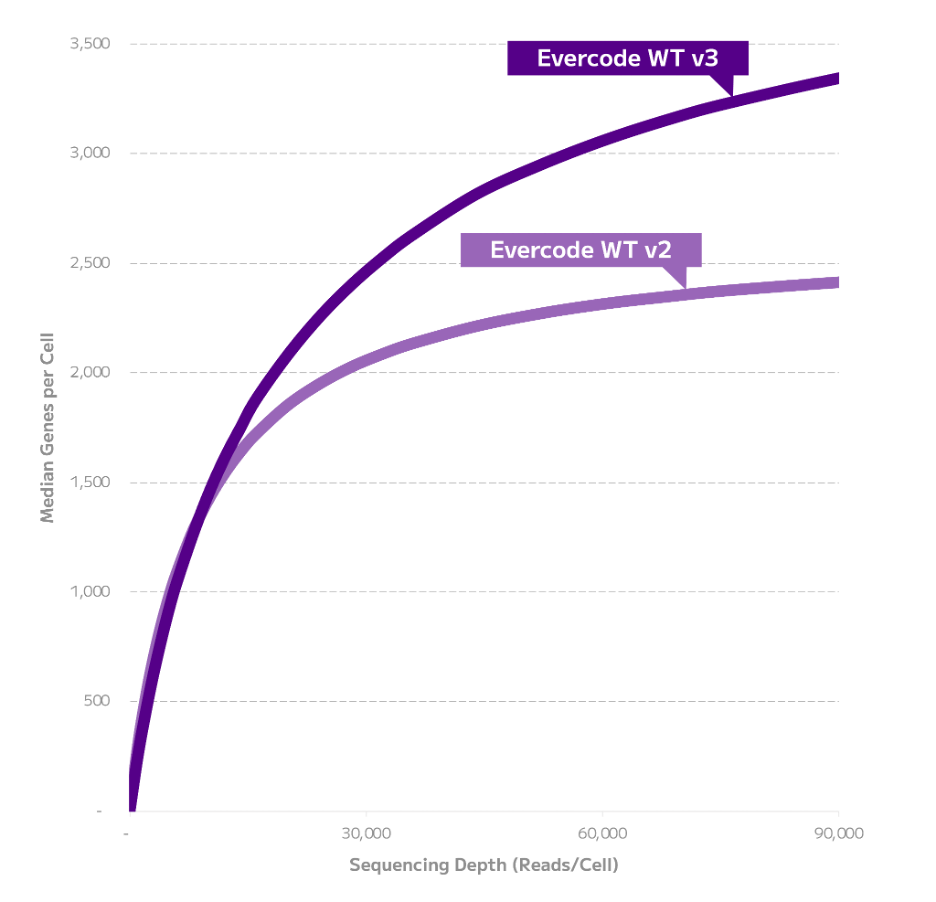
Figure 2: Gene Detection Comparison of Evercode WT v2 and Evercode WT v3 in Human PBMCs. For each kit, a 2,000 cell sublibrary was sequenced deeply, and gene detection across a range of sequencing depths is shown.
Improved Performance Without Compromises
Pseudobulk gene expression was highly correlated between Evercode WT v2 and Evercode WT v3 (r2=0.963, Figure 3). Similarly, the data is well integrated, consistently recovering equivalent cell type proportions (Figures 4-5). Consequently, researchers can switch to the Evercode WT v3 solution without complicating analysis of previous data.
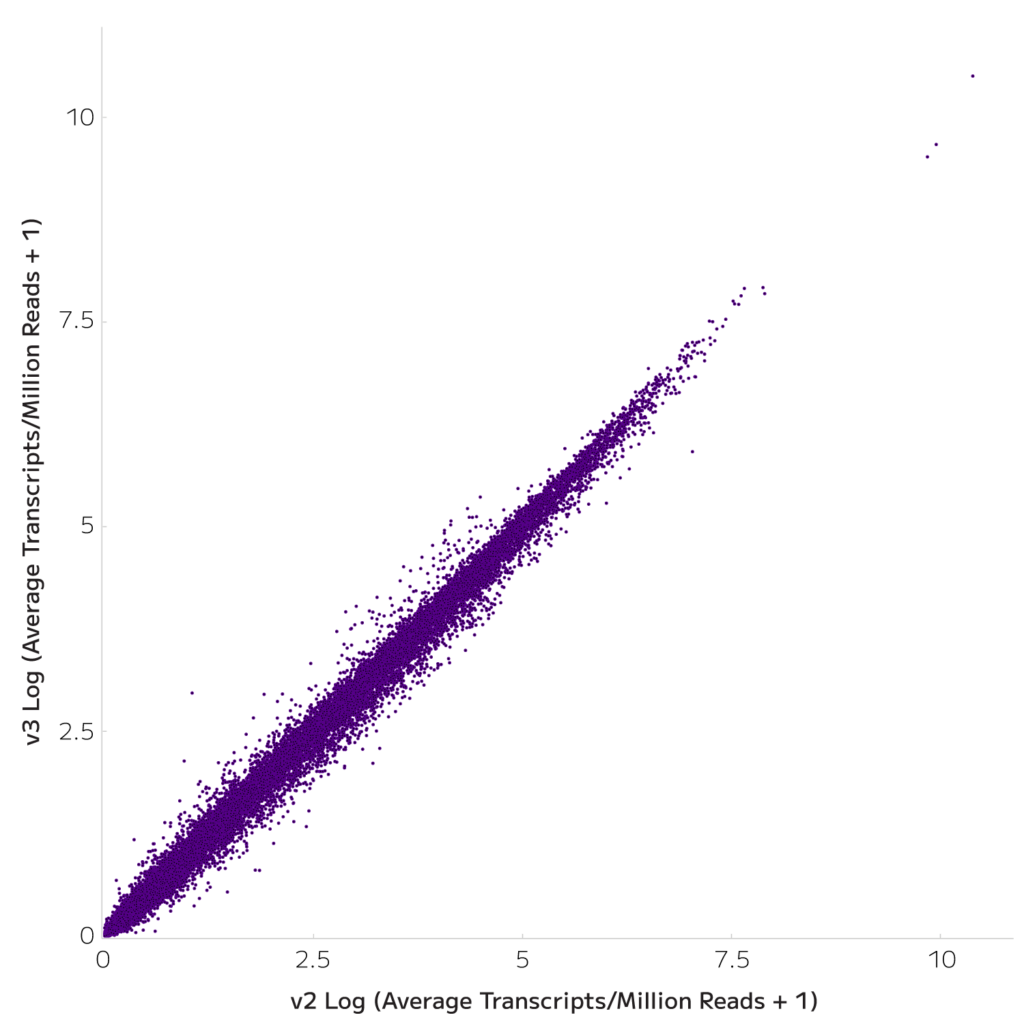
Figure 3: Gene Expression is Highly Correlated. Normalized gene expression is plotted for all 4 donors.
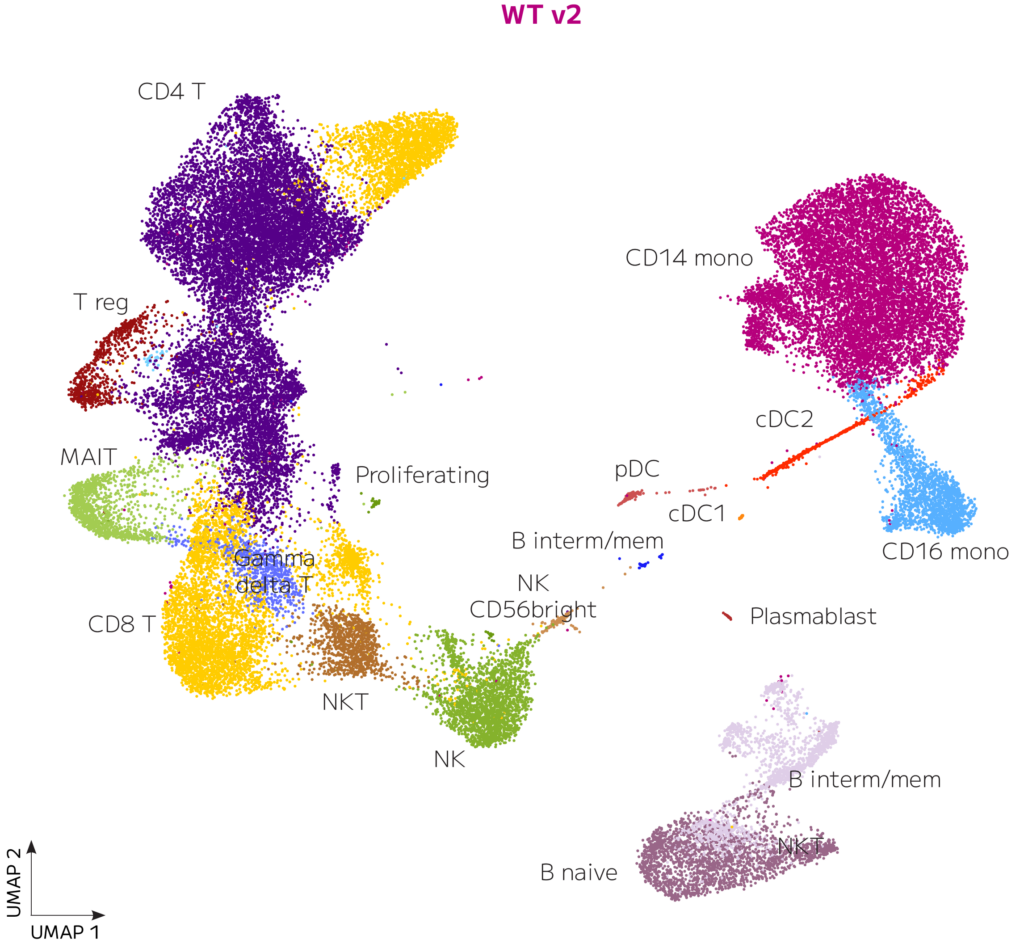
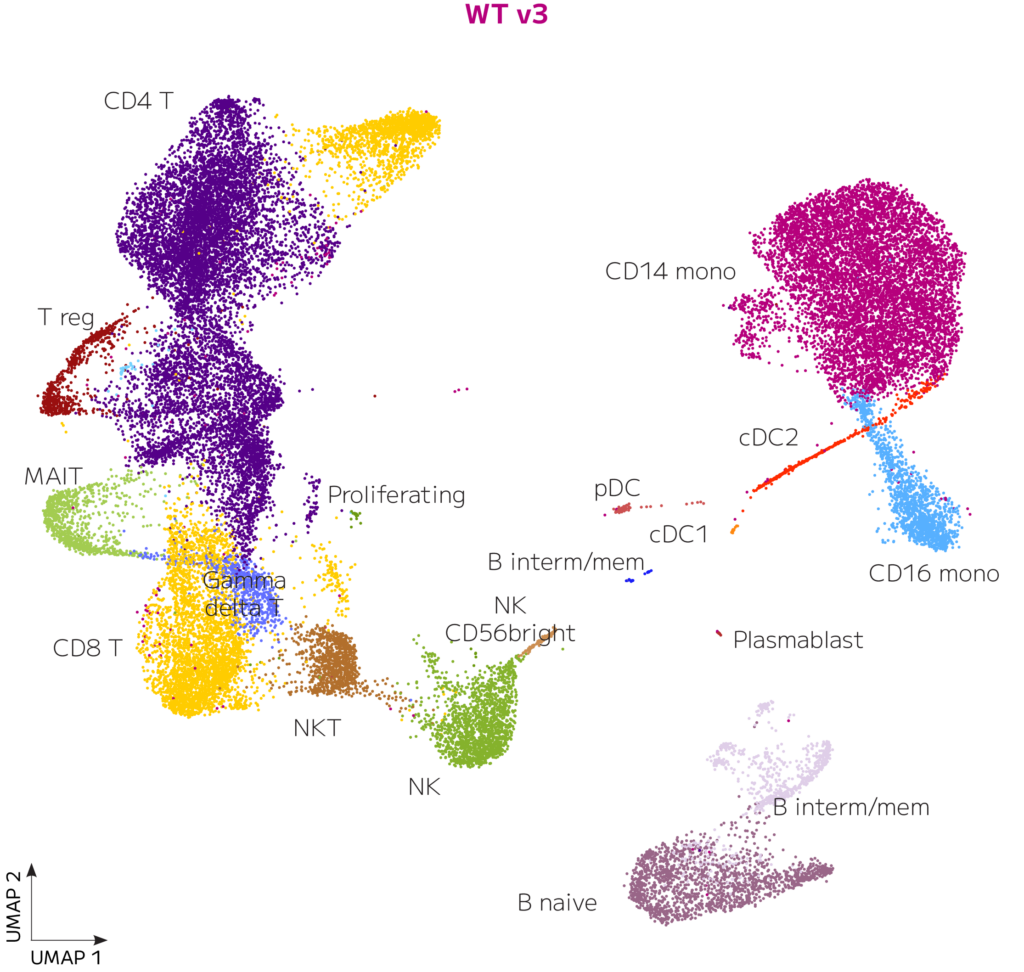
Figure 4. Clustering Is Highly Similar for Evercode WT v2 and Evercode WT v3. UMAP clusters of 49,428 and 37,699 human PBMCs are shown for Evercode WT v2 and Evercode WT v3 respectively after Seurat integration.
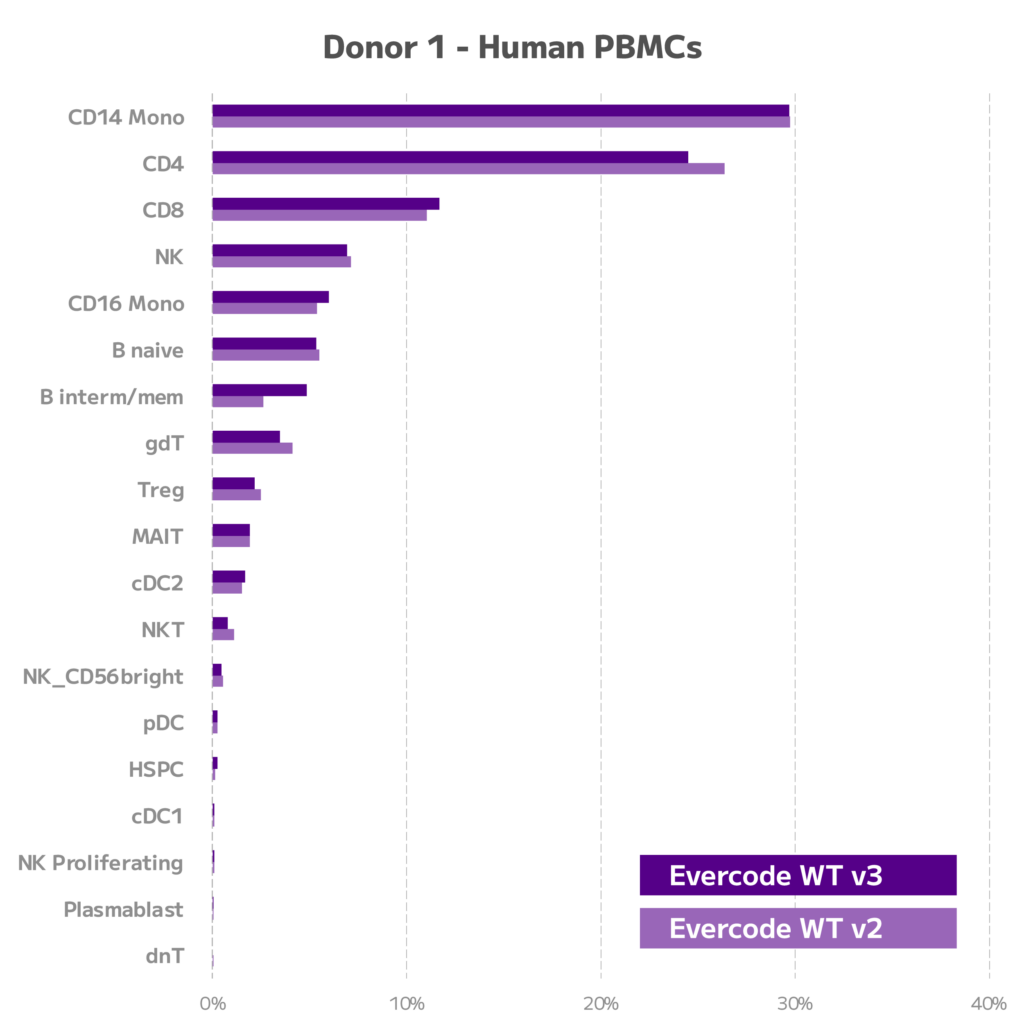
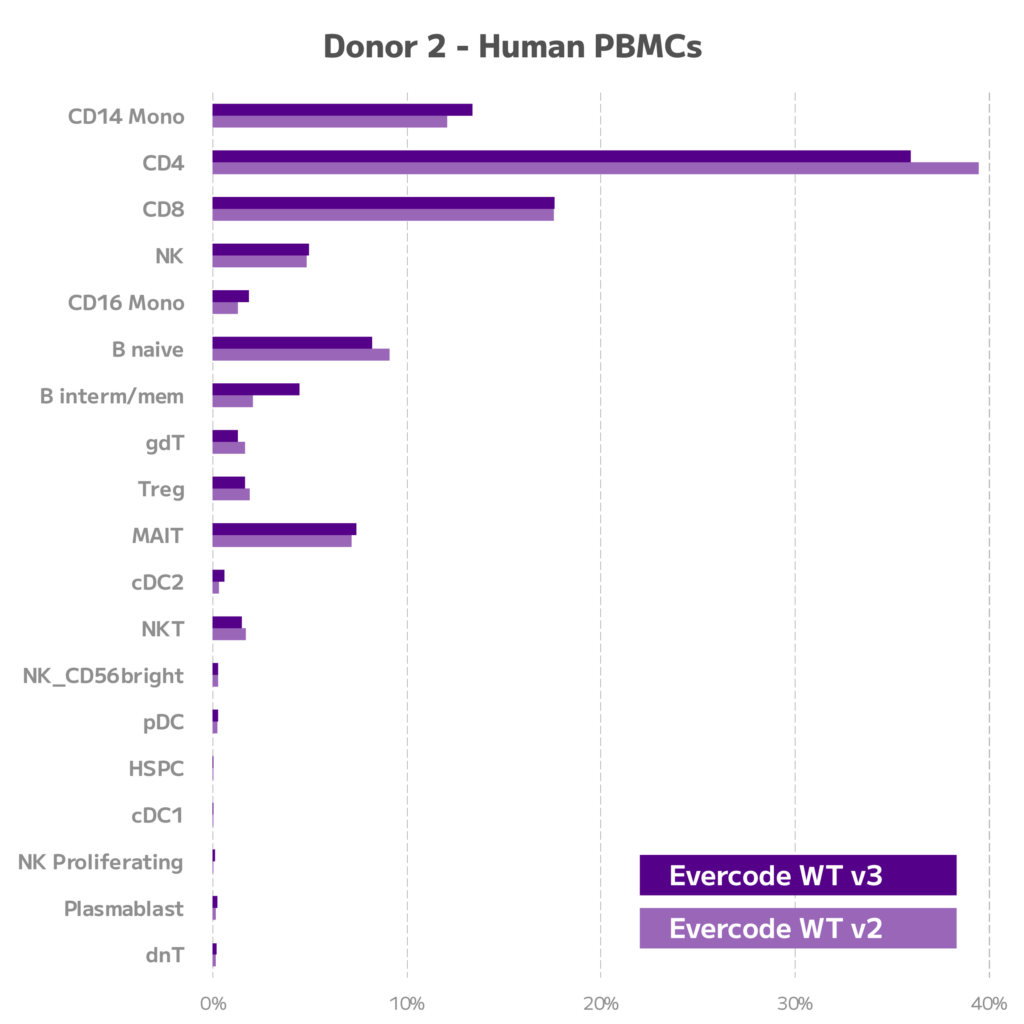
Figure 5. Comparison of Cell Type Proportions for Evercode WT v2 and Evercode WT v3. For two donors, cell type proportions are shown for Evercode WT v2 and Evercode WT v3.
Next Steps
- Download the data files generated from processing PBMC samples with Evercode WT v2 and Evercode WT v3 (below).
- Explore the contributing Evercode WT v2 data in more detail.
- Explore the contributing Evercode WT v3 data in more detail.
We're your partners in single cell
Reach out for a quote or for help planning your next experiment.