

BCR Sequencing of 1 Million Healthy and Diseased Samples in a Single Experiment
Key Takeaways
- 1 million human B cells in a single experiment
- 900,000+ unique paired clonotypes detected from Type-1 Diabetes, Multiple Sclerosis, Rheumatoid Arthritis, Crohn’s and Celiac, Healthy donor samples
- Sensitive CDR3, clonotype, and full-length detection at scale
Evercode BCR uncovered over 900,000 unique paired clonotypes across 24 samples in a single experiment.
Negatively selected B cells from 12 healthy donors were purchased. Pan B cells were isolated from 12 auto-immune diseased human PBMCs and fixed using Evercode Cell Fixation Kit v3 to stabilize the cell structure and protect the RNA transcriptome from degradation. Fixed samples were stored at -80C until all samples were ready for further processing in a single experiment with the Evercode BCR Mega kit. Whole transcriptome and BCR specific libraries were sequenced on Illumina Novaseq X, respectively. The data was analyzed using Parse Biosciences’ Analysis Pipeline v1.3.0.
Clustering of cells using Seurat 5.0 resulted in the majority of cells corresponding to the major B cell subtypes as demonstrated in the UMAP below (Figure 1).
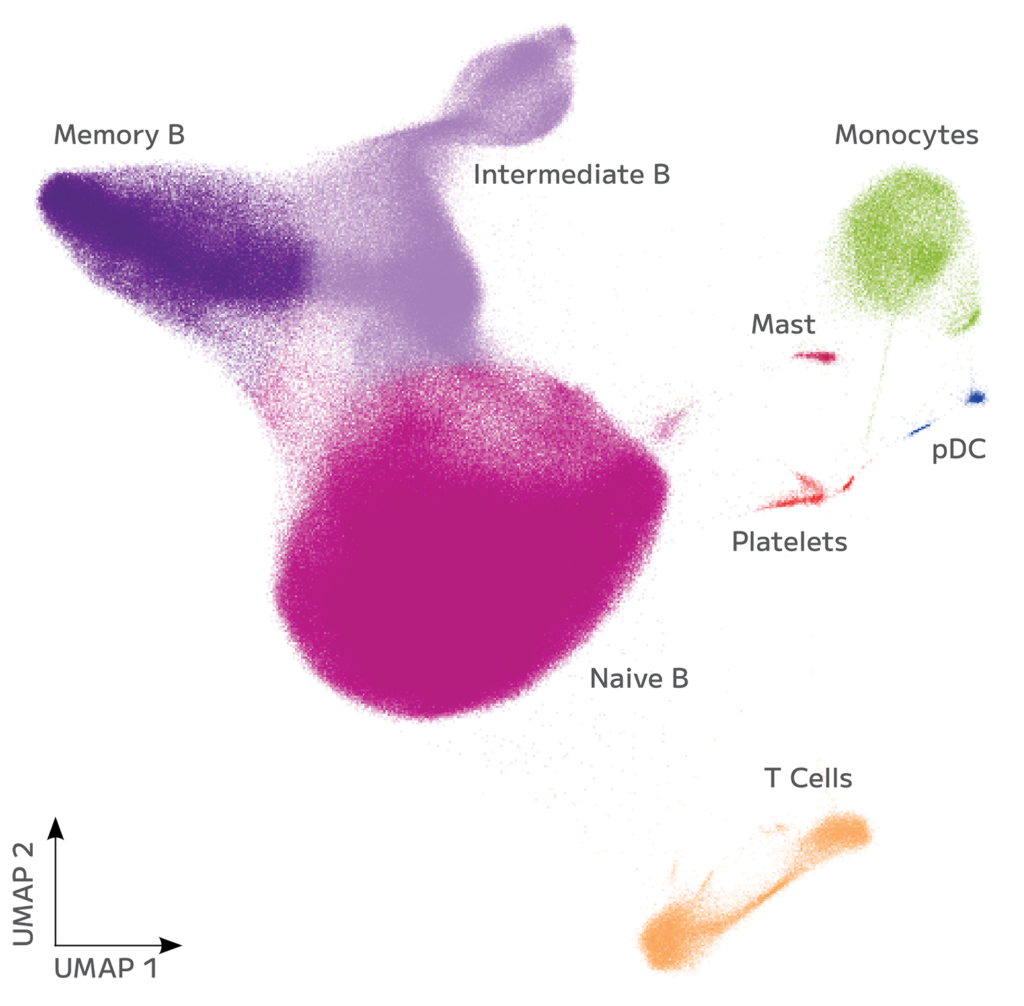
Figure 1: UMAP clustering of all cells from 24 samples in a single experiment. All major B cell subtypes and other immune cells were detected.
The assay demonstrated high sensitivity, detecting paired heavy and light chains in up to 89% of cells (Figure 2).
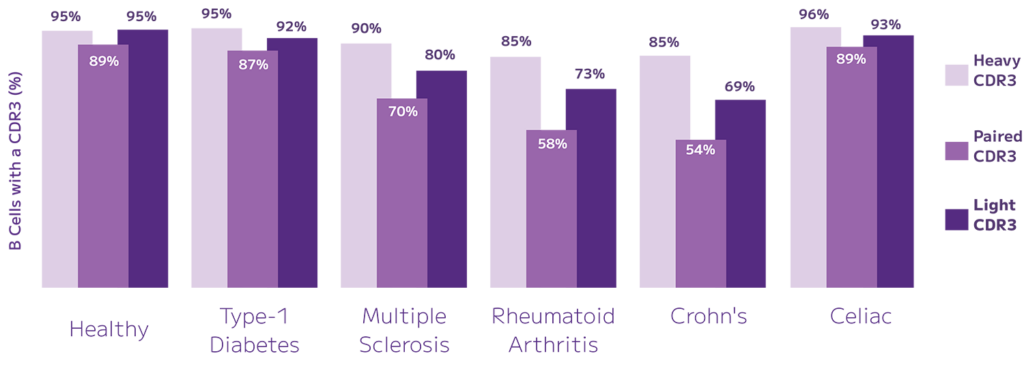
Figure 2: BCR Chain Detection Across Six Sample Groups. High rates of chain assignments across the sample groups. Paired CDR3 detection varied between 54-89%.
Sample Table
| Sample | Sex | Age | Ethnicity | Blood Type | Prep | Disease state |
| H-1 | Male | 63 | Hispanic | O Pos | Neg select B cells | Healthy |
| H-2 | Male | 24 | African American/Native American | O Pos | Neg select B cells | Healthy |
| H-3 | Male | 73 | Caucasian | O Pos | Neg select B cells | Healthy |
| H-4 | Female | 26 | Hispanic/Latino | A Pos | Neg select B cells | Healthy |
| H-5 | Female | 59 | Hispanic | A Pos | Neg select B cells | Healthy |
| H-6 | Male | 49 | Hispanic/Mexican | O Pos | Neg select B cells | Healthy |
| H-7 | Male | 58 | African American | B Pos | Neg select B cells | Healthy |
| H-8 | Male | 64 | African American | A Pos | Neg select B cells | Healthy |
| H-9 | Male | 43 | African american | O Pos | Neg select B cells | Healthy |
| H-10 | Male | 21 | African American | O Pos | Neg select B cells | Healthy |
| H-11 | Male | 50 | Caucasian | O Pos | Neg select B cells | Healthy |
| H-12 | Male | 33 | African american | B Pos | Neg select B cells | Healthy |
| MS-1 | Male | 33 | Hispanic/Latino | O Pos | PBMC | Multiple Sclerosis |
| MS-2 | Male | 49 | Caucasian | A Pos | PBMC | Multiple Sclerosis |
| RA-1 | Female | 41 | Caucasian | O Pos | PBMC | Rheumatoid Arthritis |
| RA-2 | Female | 50 | Caucasian | O Pos | PBMC | Rheumatoid Arthritis |
| CD-1 | Female | 58 | Caucasian | A Neg | PBMC | Crohn’s |
| CD-2 | Female | 22 | Caucasian | O Pos | PBMC | Crohn’s |
| T1D-1 | Female | 33 | Caucasian | O Pos | PBMC | Type-1 Diabetes |
| T1D-2 | Female | 36 | Caucasian | A Pos | PBMC | Type-1 Diabetes |
| T1D-3 | Female | 54 | Caucasian | A Pos | PBMC | Type-1 Diabetes |
| T1D-4 | Male | 49 | Caucasian | O Pos | PBMC | Type-1 Diabetes |
| T1D-5 | Female | 72 | Caucasian | O Pos | PBMC | Type-1 Diabetes |
| CE-1 | Male | 32 | Caucasian | A Neg | PBMC | Celiac |
Next Steps
- Explore the data in Trailmaker:
- Select the full or subset datasets “BCR sequencing of 1M healthy and diseased” in the Trailmaker data repository and click ‘Explore’.
- You’ll need to create a free account if you don’t already have one.
We're your partners in single cell
Reach out for a quote or for help planning your next experiment.