

Key Takeaways:
- Profile over 100 million cells across 56,829 unique drug–dose-cell line conditions
- Enhance sensitivity by maintaining high cell counts per perturbation condition
- Achieve robust and reproducible results across multi-day workflows and replicate plates
Experimental Design:
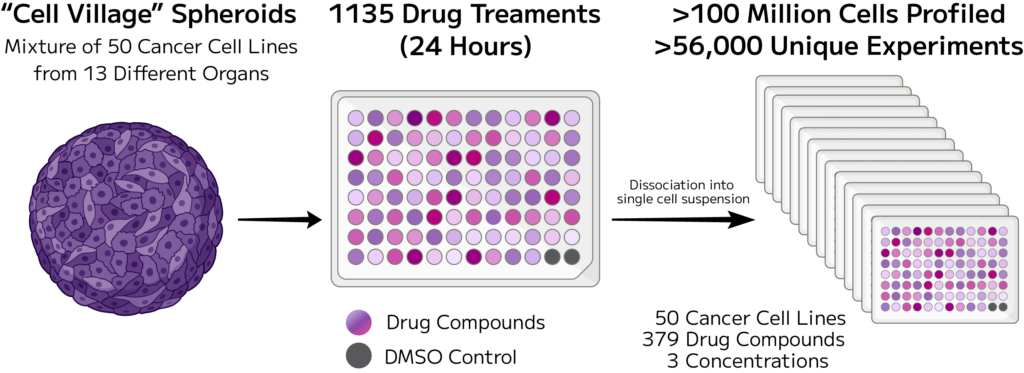
A panel of 50 established cancer cell lines were pooled in equal ratios and embedded in Cultrex to form 3D cultures. Fourteen 96-well plates were prepared, each containing ~94 unique drugs, two DMSO control wells, and one of three drug concentrations (0.05 µM, 0.5 µM, or 5 µM). Two plates served as technical repeats. In total, the project spanned 379 compounds at three different concentrations and 56,829 unique experimental conditions—one of the largest single cell perturbation screens performed to date.
Following 24-hour treatment, cells were dissociated and fixed using the Evercode Cell Fixation v3 High-Throughput Plate-Based Workflow. Barcoding was performed over 14 days using combinatorial indexing to uniquely label each cell, enabling massively multiplexed single cell resolution across thousands of conditions. cDNA capture and library preparation were performed concurrently over 19 days, and ~1,800 sequencing libraries were generated from an estimated 150 million cells.
A total of 1,786 sublibraries were sequenced on the Ultima Genomics platform, achieving a mean read depth of ~10,000 reads per cell. Sequencing data were processed with the Parse split-pipe pipeline v1.4.0, and cells were called from the combined dataset. Outputs were demultiplexed with Demuxlet using a curated SNP reference to assign cells to their respective lines. Quality control steps included filtering out low-quality cells, doublets, and cells with high mitochondrial content prior to downstream analysis for a total number of 100,648,790 cells profiled.
Results:
We recovered 100,648,790 high-quality cells across 56,829 experimental conditions, making this one of the largest single cell perturbation screens to date. Each cell was mapped to its drug and concentration using well barcodes introduced during combinatorial indexing. Cell line identity was determined via SNP-based demultiplexing with Demuxlet, enabling multiplexed screening of 50 pooled cancer cell lines in the same wells.
This pooled design allowed for the exploration of how diverse genetic backgrounds influence responses to small-molecule treatments. The UMAP of all demultiplexed cells revealed distinct clustering by cell line, confirming accurate cell line deconvolution (Figure 1).

Figure 1. A representative UMAP of a 10M subset showing a clear separation of clusters reflects accurate demultiplexing. Each point represents a single cell colored by assigned cell line.
Differential expression (DE) analysis revealed robust transcriptional changes in response to treatment, with 146 compounds up/down-regulating over 1,000 genes in at least one cell line and 264 compounds up/down-regulating over 500 genes in at least one cell line (Figure 2). These results highlight the full scalability and throughput of the GigaLab platform, enabling tens of thousands of perturbation conditions to be profiled in parallel at single cell resolution to capture meaningful transcriptional insights.
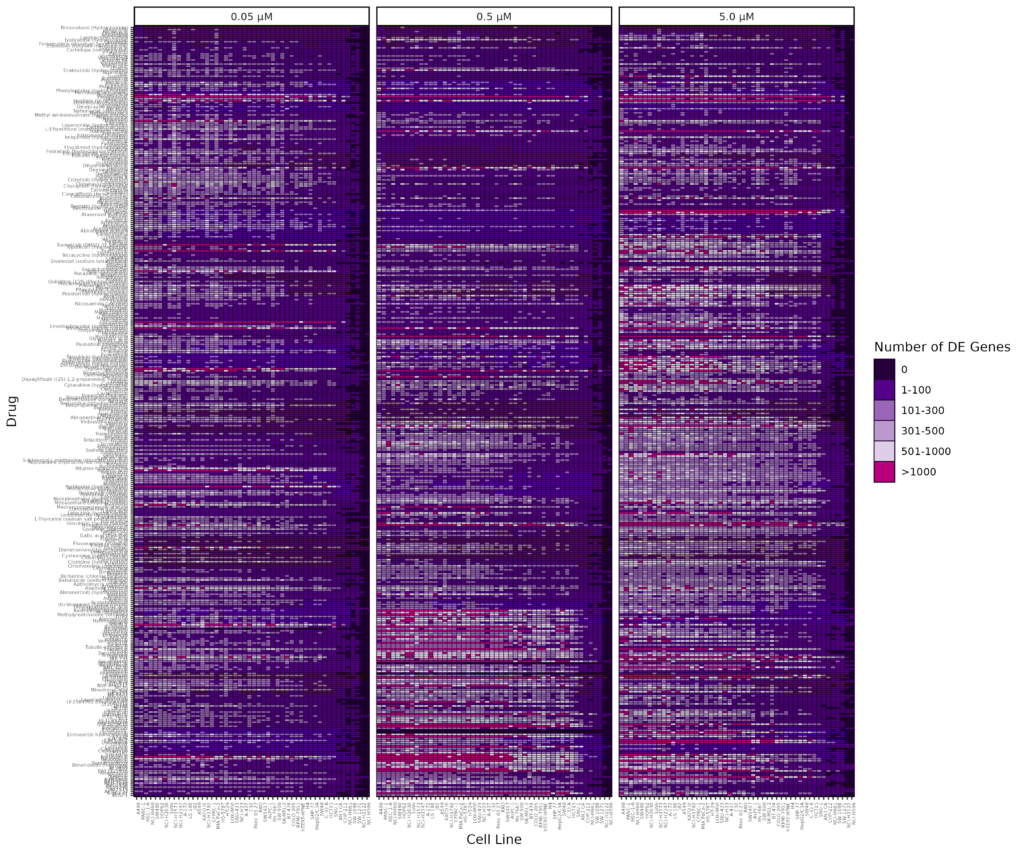
Figure 2. Heatmap of differentially expressed gene counts per cell line and compound across three concentrations. DE genes were identified using log2 fold change of ≥ 0.585 or log2 fold change ≤ -0.585 and adjusted p-value < 0.001 relative to DMSO controls. The full list of drugs screened is available to download below.
To assess how cell number affects transcriptional resolution, we downsampled one representative plate. As the average number of cells per condition decreased, so did the number of differentially expressed genes detected. The resulting heatmap (Figure 3) illustrates that low cell counts capture limited responses, while higher counts reveal a more accurate picture of the broader transcriptional changes. This underscores the importance of scale: detecting subtle, context-dependent effects requires high cell numbers, reinforcing the value of running this experiment at GigaLab scale.
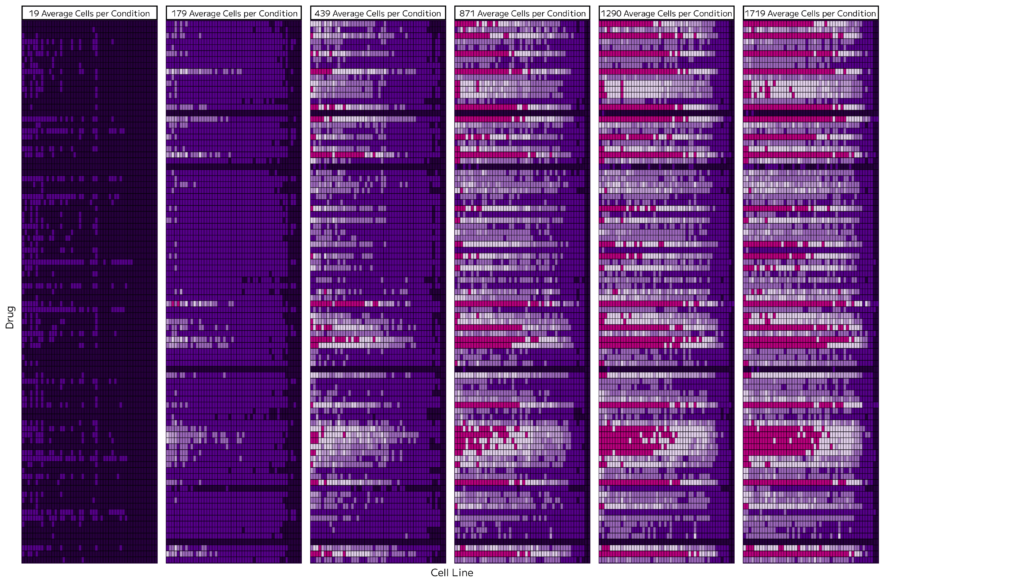
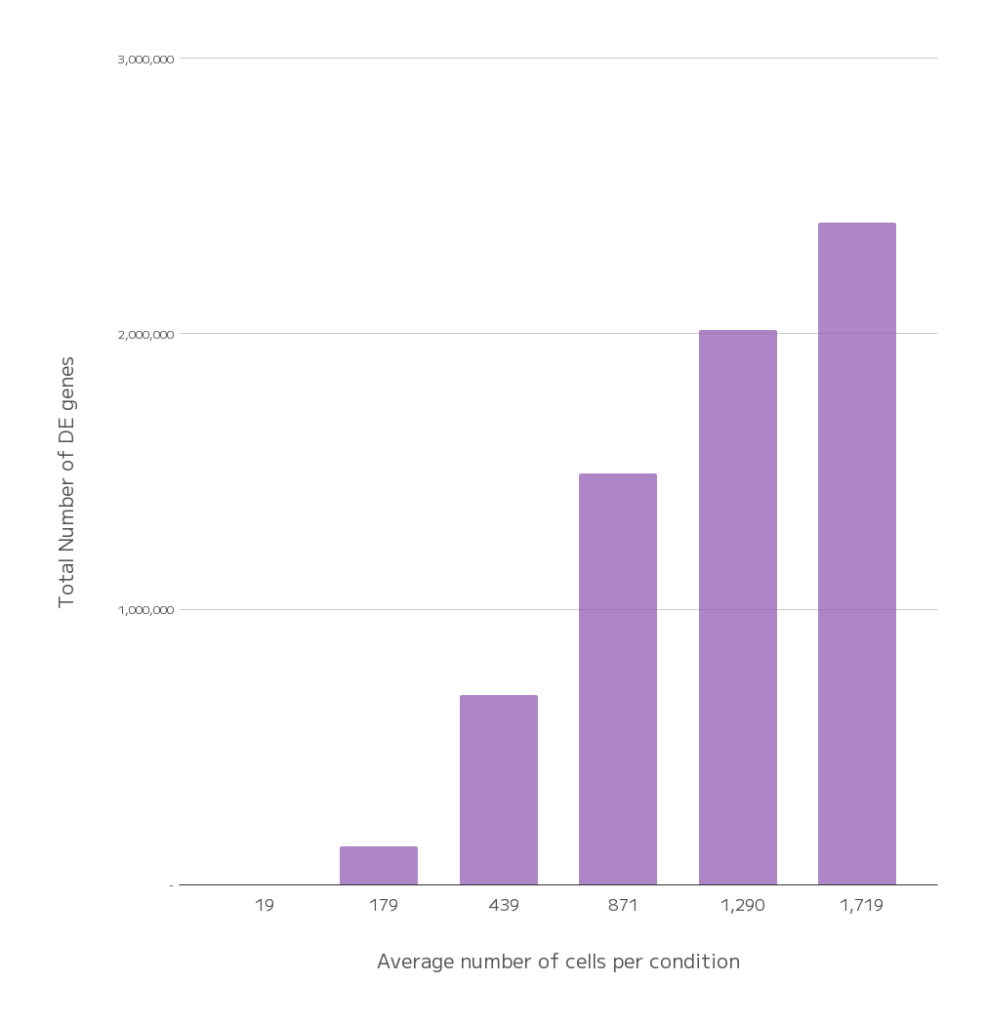
Figure 3. Effect of cell count on differential expression detection. A) Heatmaps showing the number of differentially expressed genes (DEGs) across varying average cell counts per condition. B) Bar plot showing the relationship between average cell count and total DEG events.
To assess the reproducibility of the experiment, we compared two technical replicates—Plate 6 and Plate 14—each containing the same pool of drugs and cell lines. One million cells from each plate were clustered together. The resulting UMAP (Figure 4) showed strong overlap, with cells grouping by cell line rather than by plate. This confirms the high technical reproducibility of the GigaLab platform and its ability to deliver consistent results across large-scale, multi-day workflows.
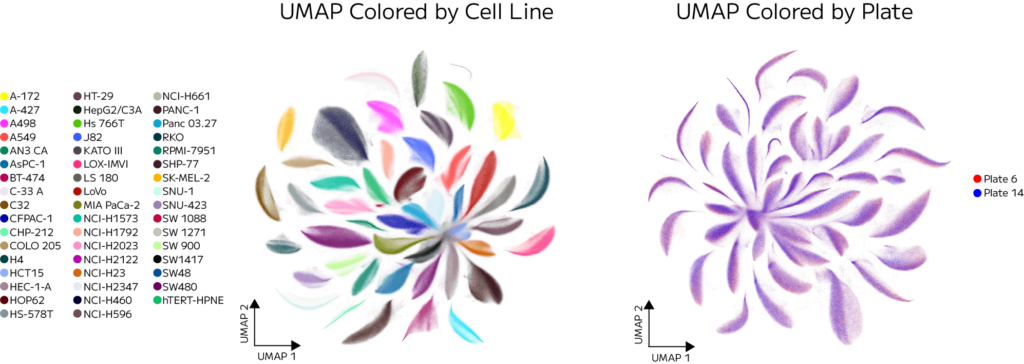
Figure 4. UMAPs from replicate plates (Plate 6 and Plate 14) colored based on cell line and plate. Cells cluster based on biological identity, not plate of origin, demonstrating the reproducibility and consistency of the GigaLab platform across experimental replicates.
Tutorials
Tahoe-100M single cell perturbation atlas data analysis
Fabian Theis lab at Helmholtz-Munich
We offer an optimized analysis pipeline specifically designed for large-scale single cell perturbation data, leveraging the power of RAPIDS and Scanpy. The repository includes GPU- and CPU-accelerated PCA computation and UMAP visualization, enabling fast dimensionality reduction and interactive data exploration.
Link: https://theislab.github.io/vevo_Tahoe_100m_analysis/
Next Steps
We're your partners in single cell
Reach out for a quote or for help planning your next experiment.