

Single Cell RNA Sequencing of 1 Million Human Cells in a Single Experiment
Key takeaways from profiling 1 million cells in a single experiment
- Low frequency cell types identified from every sample
- Cell fixation was key to analyzing 1 million cells in a single experiment
- >27,000 cells analyzed per sample
Low frequency cell types identified from every sample
By sequencing the transcriptomes of 1 million cells, we were able to clarify the high level and distinct sub-types of cells that were found in each sample. With more than 27K cells captured from each sample, gene expression profiles were generated for low frequency cell types. See the UMAP in Figure 1 (below), which contains clusters of both subtypes of classical dendritic cells (cDC1, cDC2) and plasmacytoid dendritic cells (pDC) that are normally not captured in scRNA-seq assays with fewer cell numbers.
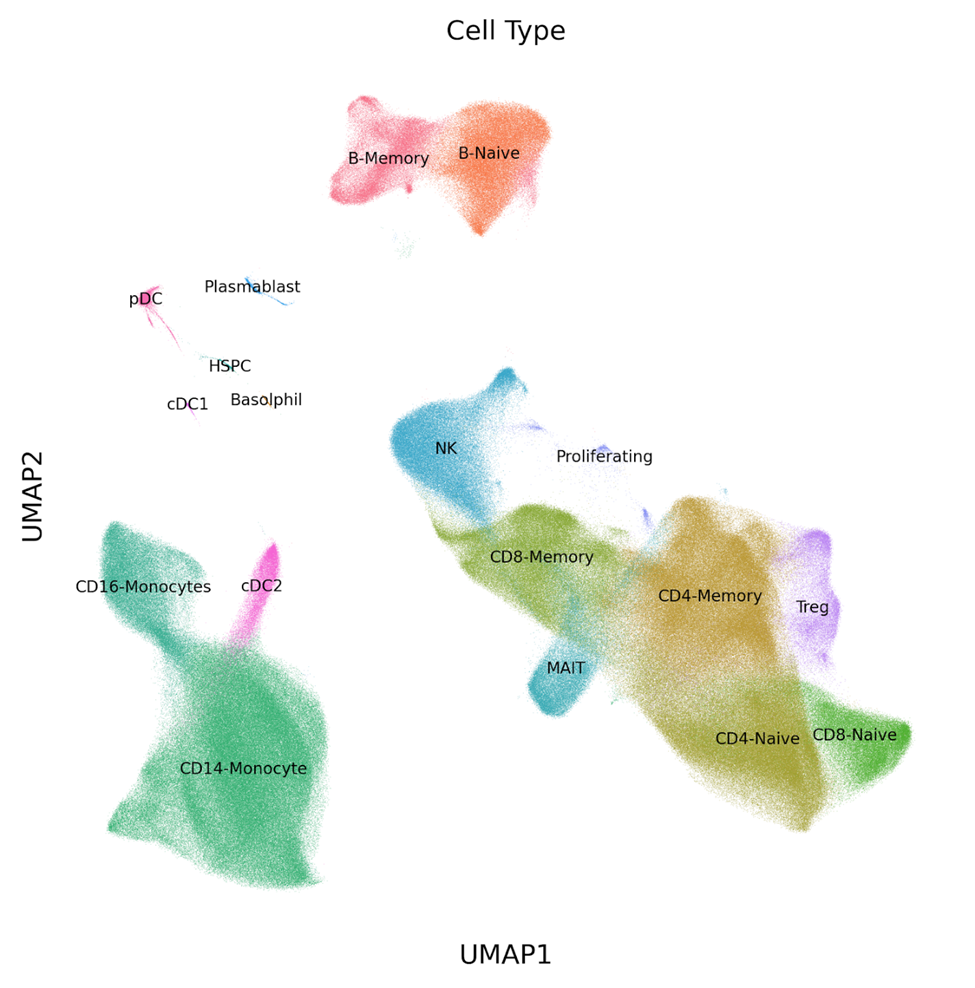
Figure 1: UMAP of 1 million PBMCs analyzed in a single experiment with the Parse Biosciences Evercode™ Whole Transcriptome Mega Kit. Several low frequency cell types (cDC1, cDC2, pDC) can be distinguished among the clusters.
Cell fixation enabled the analysis of 1 million cells in a single experiment
Samples included 12 healthy donors and 12 Type-1 diabetic donors. These samples were collected a few samples at a time over a three-week period until all 24 samples had been collected (see Figure 2, below).
The samples used for this study were peripheral blood mononuclear cell samples (PBMCs) that were purchased from a commercial source. Donors signed an informed consent agreement at the time of sample collection.
Figure 2: Diagram of the experimental workflow, starting with collecting 24 samples over a three-week period. Samples were fixed at the time of collection and stored at -80C until all samples had been collected and fixed. Then all 24 samples were processed with a single Evercode Whole Transcriptome Mega kit to generate more than 1 million individually barcoded cells that were used to generate a sequencing library. Sequencing was performed with an Illumina Novaseq.
Figure 2 (above) illustrates the workflow for this experiment. As samples were collected, they were fixed using a Parse Biosciences Cell Fixation Kit to stabilize the cell structure and protect the RNA transcriptome from degradation.
Fixed samples were stored at -80C until all samples were ready for further processing in a single experiment with the Parse Biosciences Evercode Whole Transcriptome Mega kit, followed by sequencing on a S4 flow cell with an Illumina Novaseq 6000.
The resulting FASTQ files were analyzed using v0.9.6 of our data analysis pipeline. This analysis generated 24 individual Experimental Summary Report files, one for each individual sample used in the study.
Screenshots of the data visualization from a single Experimental Summary Report file (from Sample 15) is below (Figures 3 and 4).
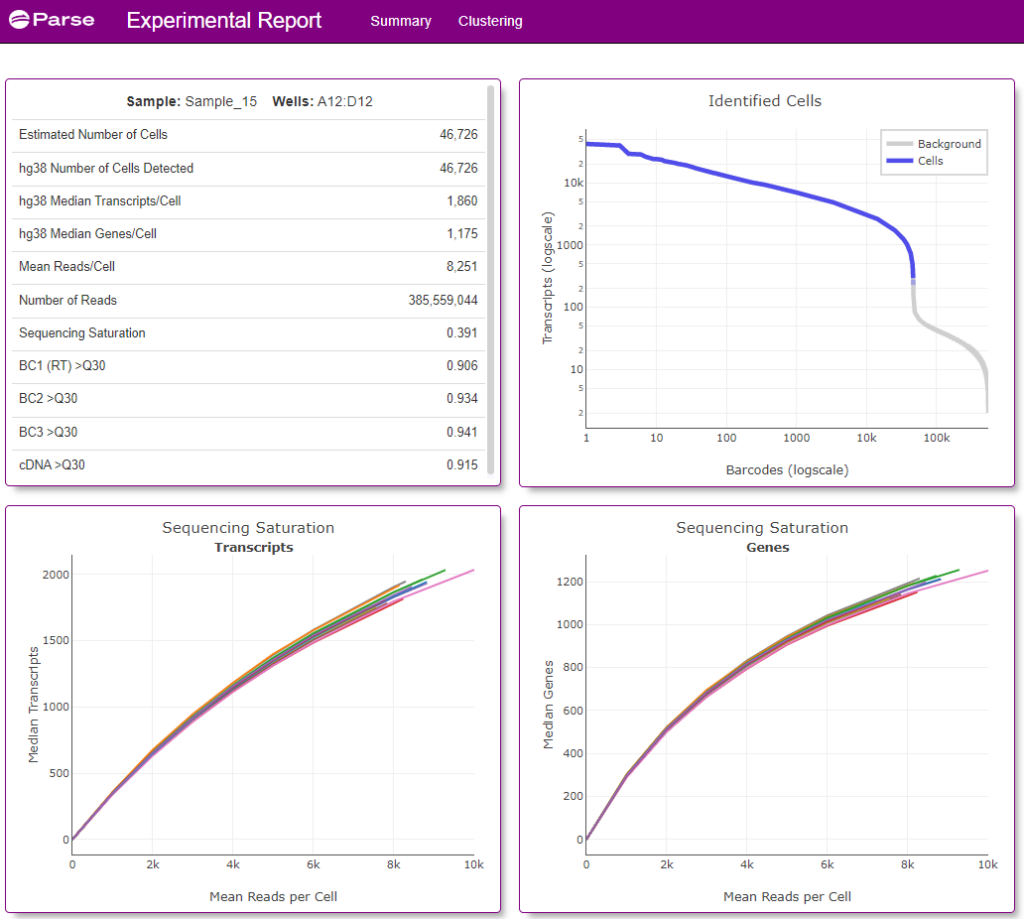
Figure 3: Screenshot of the Summary tab from the Experimental Summary Report file from sample 15 (a Type 1 Diabetes patient) processed as part of this 1 Million Cell study. Information provided includes estimated number of cells analyzed from the sample, median number of transcripts and genes detected from the cell, as well as other sample and sequencing quality metrics.
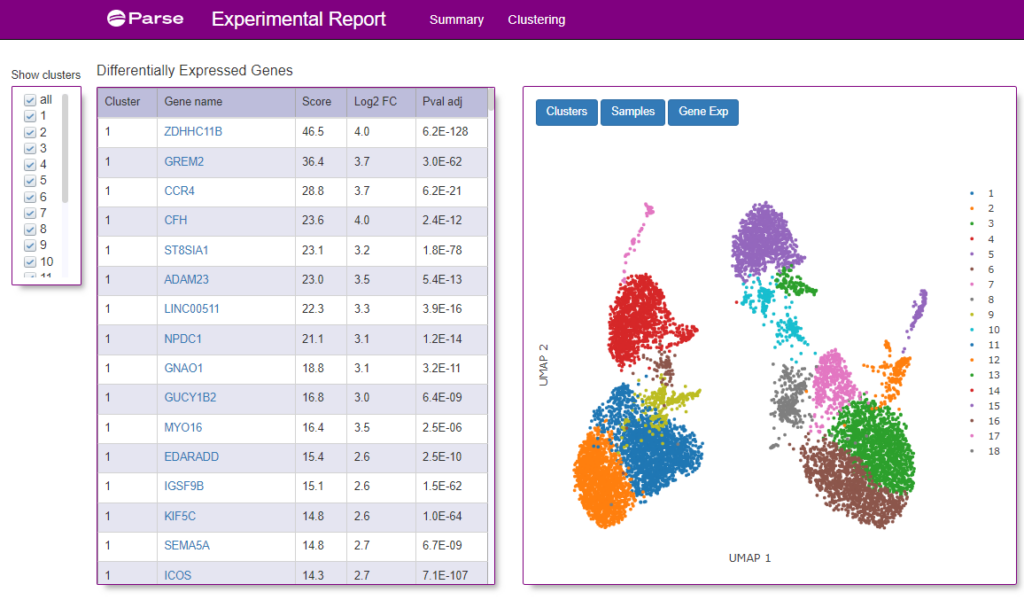
Figure 4: A screenshot of the Clustering tab from the Experimental Summary Report file from the same sample as show in Figure 3. A UMAP graph of the clusters of different cells identified from the donor is shown on the right. On the left is a table of what genes were identified within each cluster.
>27,000 cells captured from each sample
The bar chart below (Figure 5) contains the number of cells analyzed from each sample as well as breakdown of the different cell types identified within each sample.
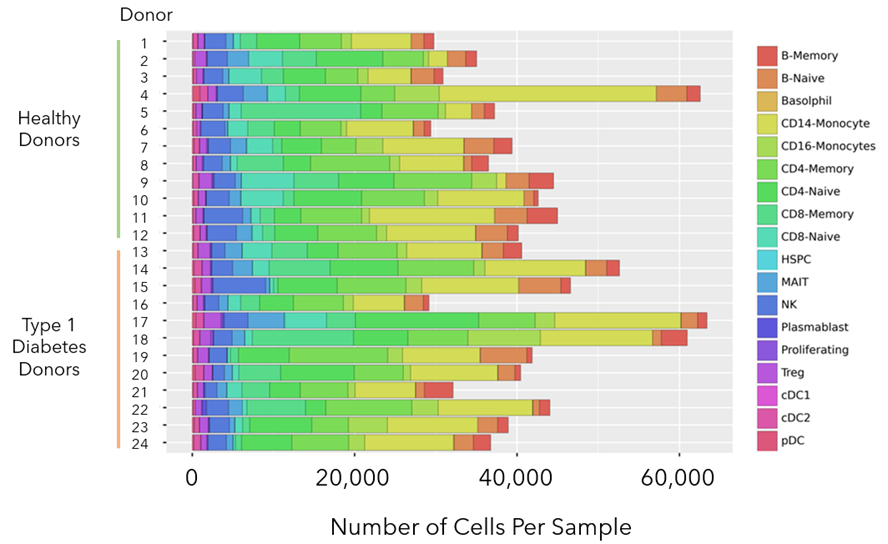
Figure 5: Bar chart with the total number of cells analyzed per sample, as well as the proportion of each cell type within the sample. At least 27K cells were analyzed from each sample and in some cases more than 60K. Representation of rare cell types like dendritic sub-types cDC1, cDC2, and pDC could be found across all samples.
Next Steps
- After completing the contact form you will be able to view links to 24 downloadable Experimental Report summary files (in .html format), one for each of the samples used in this study. The Experimental Report summary files available for viewing were generated using v0.9.6 of our data analysis pipeline (released on 06/2022).
- Explore an example analysis of this dataset performed using Scanpy and Harmony. The tutorial also includes the gene matrix file, cell metadata file, and genes file.
Downloads
We're your partners in single cell
Reach out for a quote or for help planning your next experiment.