

Performance of Evercode™ WT in a Multi-Species Cell Line Experiment
Key takeaways
- Sensitivity increased in both the human and mouse cell line samples
- Multiplet rate is drastically lower than droplet-based methods
- Unbiased gene expression
More genes with less sequencing
Evercode WT v2 detected substantially more genes and transcripts in both the human cell line (embryonic kidney, HEK293) and mouse cell line (fibroblast, NIH/3T3) tested. To compare, a 1:1 mix of each cell line (approximately 7,000 cells each) was prepared with both Evercode WT v1 and Evercode WT v2. The gene detection is plotted against sequencing depth for each product version is shown in Figure 1.
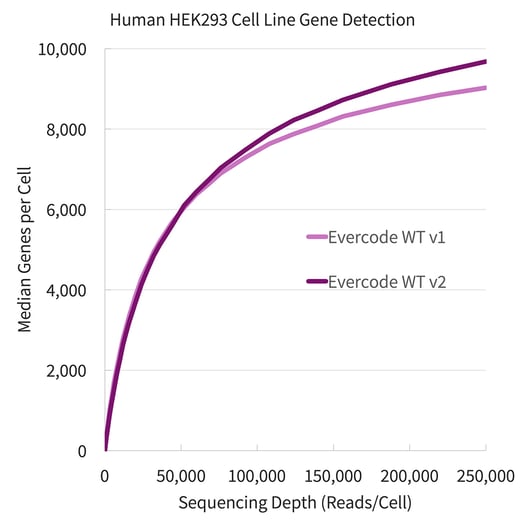
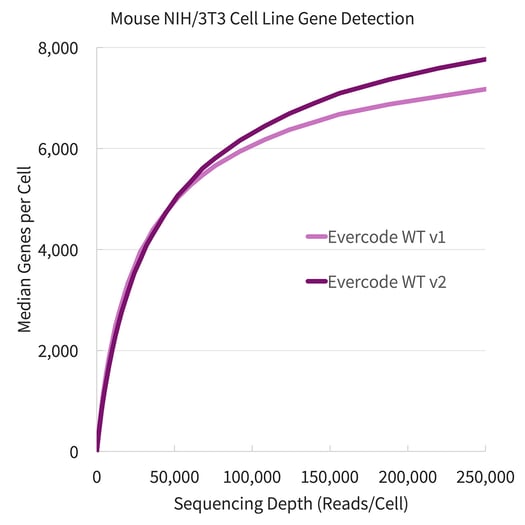
Figure 1. Gene Detection for Human HEK293 and Mouse NIH/3T3 Cell Lines. Fixed cells from the HEK293 cell line (above, left) and the NIH/3T3 cell line (above, right) were prepared using Evercode WT v1 and Evercode WT v2 in parallel. A sublibrary from each experiment was sequenced and processed using the Parse Biosciences data analysis pipeline.
Multiplet rate is drastically lower than droplet-based methods
The multiplet rate of the Evercode WT v2 Solution was observed at 1.7% (Figure 2) – up to an order of magnitude reduction over competing droplet-based approaches. Species mixing studies allow the investigation of cell identification specificity as transcripts can be accurately mapped to individual genomes. Cells (or nuclei) with transcripts that map to more than one genome indicate that the cell is not uniquely identified in the sample and present a noise component to the method. This effect is pronounced in droplet-based methods and is typically attributed to more than one cell being encapsulated with a cell identifier tag. High multiplet rates significantly contribute to the amount of sequencing required for an experiment, as they must be sequenced and bioinformatically removed. In most cases, bioinformatic removal is not exhaustive and reduces confidence in lowly expressed genes.
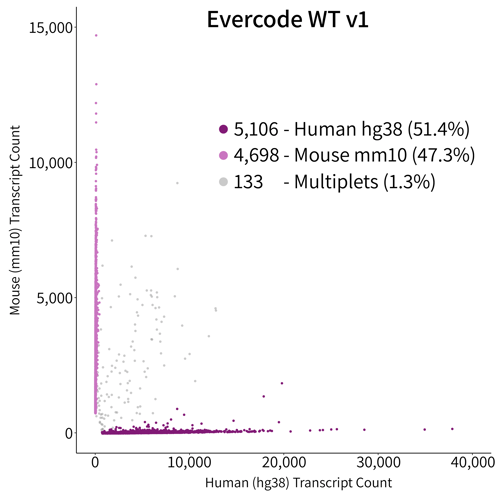
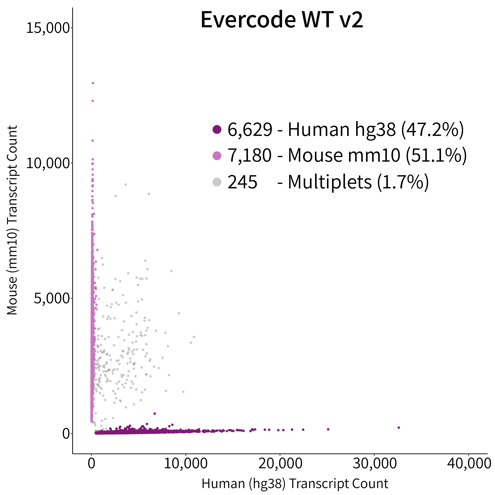
Figure 2. Species Mixing Multiplet Analysis. Species mixture plot of HEK293 (human cell line) and NIH/3T3 (mouse cell line) cells mixed together in equal numbers and prepared in parallel with Evercode WT v1 and Evercode WT v2. The detected multiplet rate was 1.7% for Evercode WT v2, nearly identical to the 1.3% of the identical sample prepared using Evercode WT v1.
Unbiased gene expression
Gene correlation plots confirm unbiased gene expression of samples prepared with Evercode WT v1 and Evercode WT v2 (r2=0.983 for human HEK293, r2=0.981 for mouse NIH/3T3) (Figure 3).
Researchers can transition to Evercode WT solution v2 kits to benefit from greater gene sensitivity, improved sample robustness, and lower multiplet rates while integrating data with other studies.
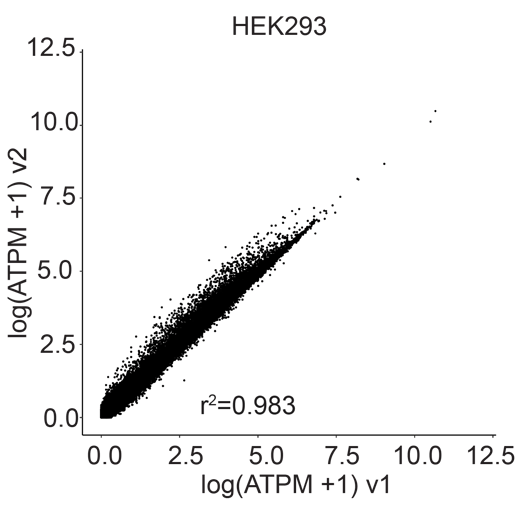
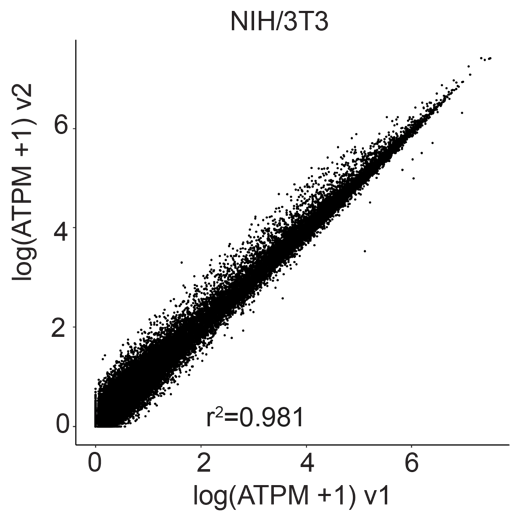
Figure 3. Gene Expression Correlation Between Evercode WT v1 and Evercode WT v2. Gene expression correlation plot from a HEK293 (human cell line, left) sample and the NIH/3T3 (mouse cell line, right) prepared using Evercode WT v1 and v2 in parallel. The r 2 values indicate high correlation between the Evercode WT chemistry versions.
Next Steps
- Download the data files generated from the preparation and analysis of the HEK293 and NIH/3T3 samples. These datasets include the experimental summary reports, the digital gene matrix files, the cell metadata files, and genes files.
- Explore more by reviewing the full experimental plan and detailed results across multiple sample types in the bioRxiv paper.
We're your partners in single cell
Reach out for a quote or for help planning your next experiment.