
Before choosing a probe-based approach, consider how the assay may shape interpretation.
Don't Let Probe Design Define Your Biology
Probe based assays can make gene expression measurements depend on probe number, binding efficiency, and target region selection. Evercode WT uses reverse transcription-based whole transcriptome profiling to keep your data closer to the biology you set out to measure.
Are You Measuring Gene Expression or Probe Design?
When probes miss a transcript, biology can look absent—leaving you unsure if it’s truly gone or just undetected.
If a probe does not bind well to a transcript, the biology may appear absent, even when it is present. That creates a false negative risk. In a discovery study, that missed signal could be a key pathway, biomarker, cell type-specific event, or therapeutic target.
If the signal is missing, how do you know whether it is biology or probe design?
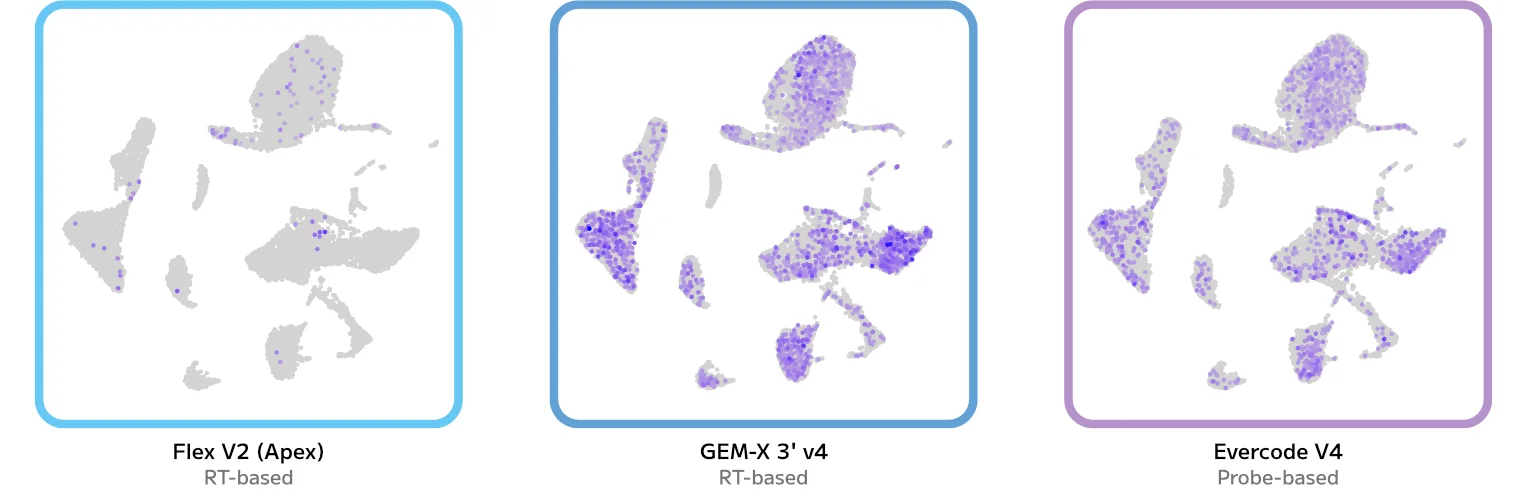
PTPRK
Cell Types
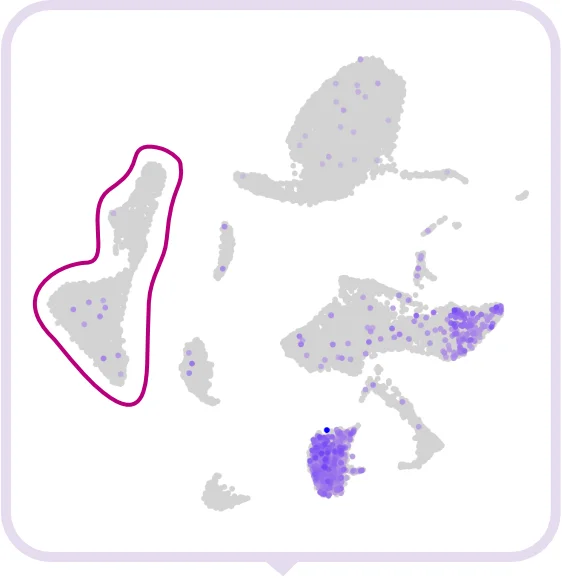
Flex V2
RT-based
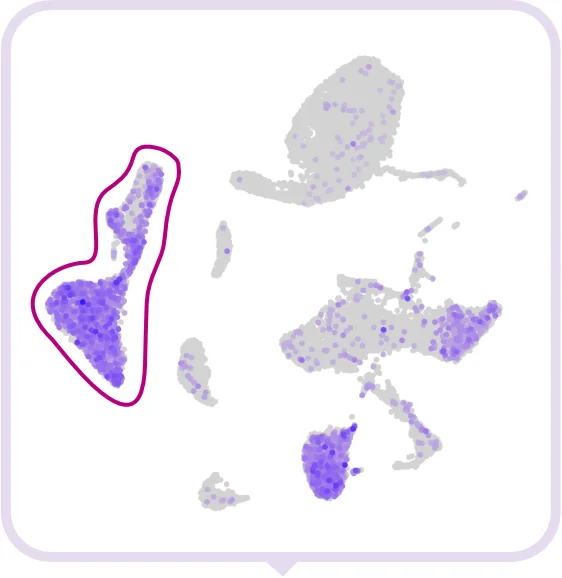
GEM-X 3'
RT-based
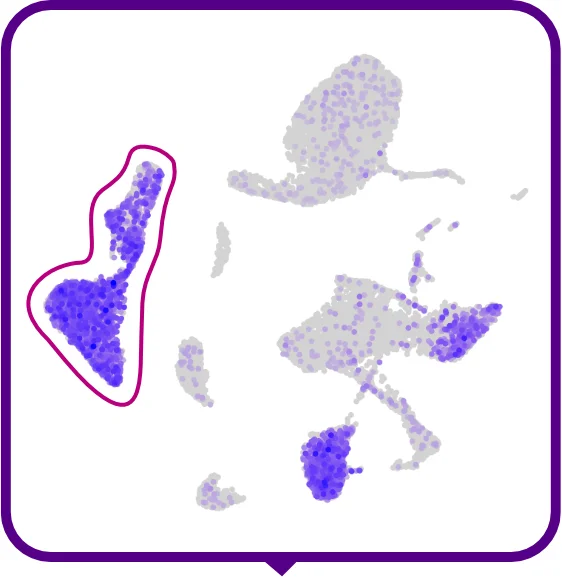
Evercode V4
Probe-based
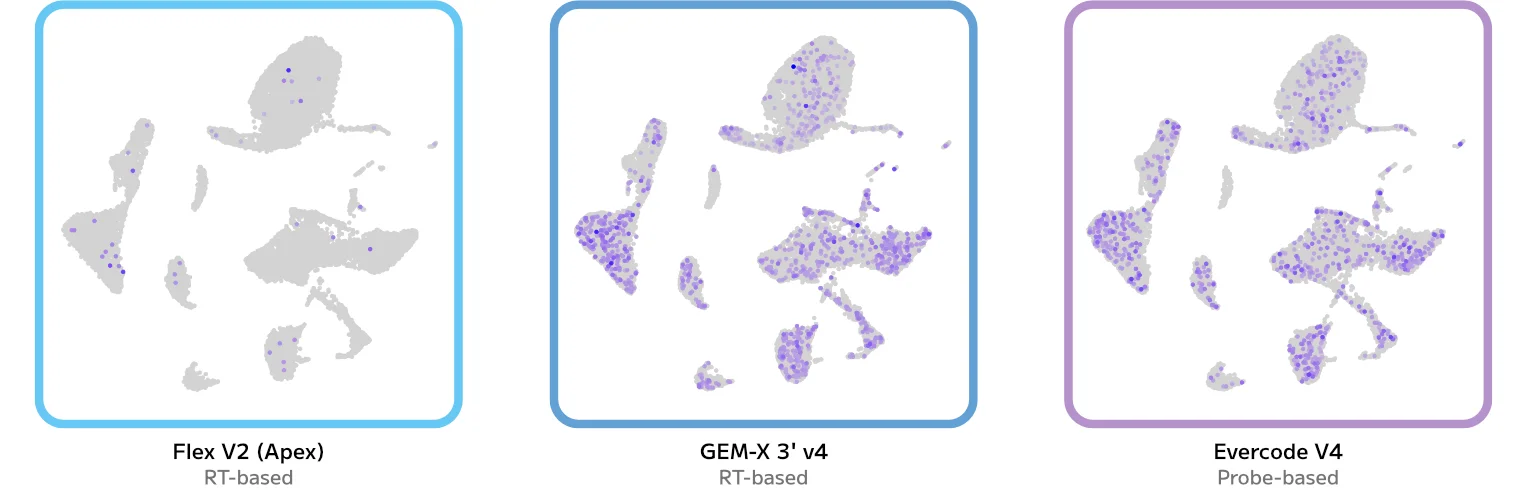
PTPRK: A Real Signal That Looks Absent
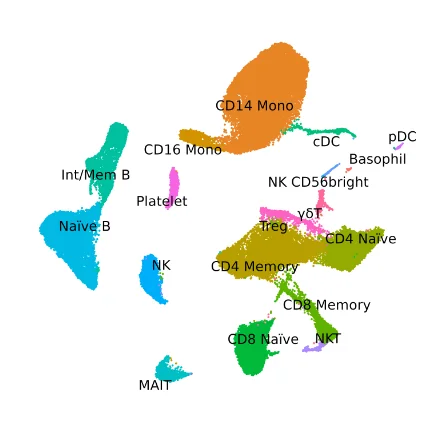
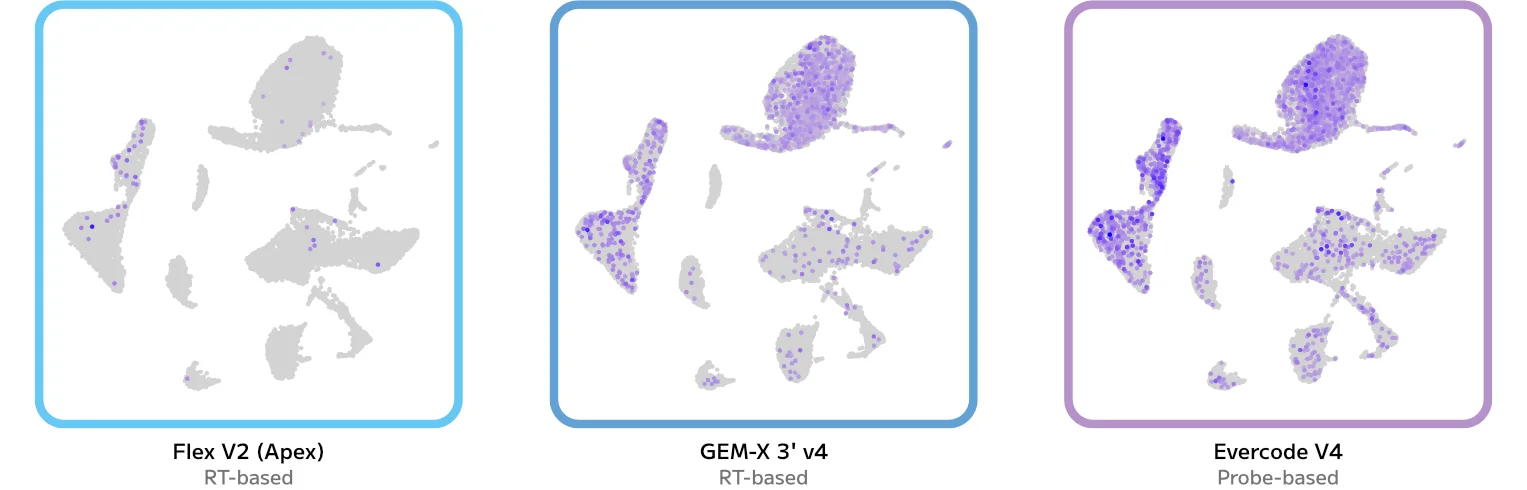
PTPRK is an important gene expected to be expressed in both B cells and CD4 T cells, and that is what RT-based methods show, with consistent patterns across both GEM-X 3′ and Evercode V4. Flex V2, using a probe-based approach, misses PTPRK expression entirely in the B cell population. The signal is not gone, but it is undetected. Across many genes, RT-based methods agree while probe-based detection shows little, none, or different patterns, leaving you unsure whether a missing signal reflects biology or probe design.
Signal Level Does Not Always Mean Expression Level
Probe-based assays can assign multiple probes to the same gene, but those probes do not always produce similar counts.
When counts vary across probes, summed expression values can reflect probe design and performance rather than transcript abundance alone. That can make it harder to compare expression across genes, cell types, or datasets.
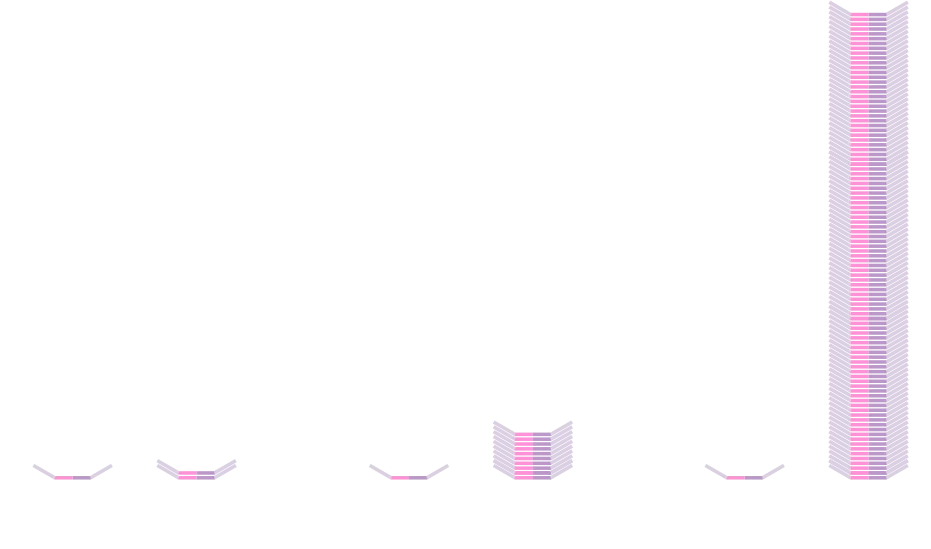

Probe-Dependent Signal: When Counts Reflect Probe Performance, Not Biology
When a gene is targeted by multiple probes, each binds a different region of the same transcript, and if they measured the same RNA abundance you would expect similar counts. Often they do not agree. For 7,470 genes the highest-counting probe produced more than twice the counts of the lowest for that same gene, for 1,378 genes the difference exceeded 10-fold, and for 161 it exceeded 100-fold. Because expression is summed across these probes, the final value reflects probe design and performance, not transcript abundance alone. More signal does not always mean more expression.
A False Signal Can Look Biological
With probe based measurement, a signal can look like a biological discovery when it is actually a probe-driven artifact.
False positives can make it harder to separate true biology from assay-driven signal.
When a signal appears in one technology but is not supported by reverse transcription-based (RT) whole transcriptome methods, it can raise questions about whether the signal reflects the sample or the assay. In some cases, that signal could influence conclusions about cell state, disease relevance, or therapeutic potential.
SRXN1
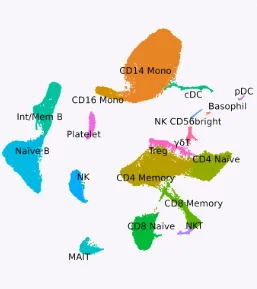
Cell Types
Flex V2
RT-based

GEM-X 3'
RT-based

Evercode V4
Probe-based
SRXN1: A Case Study in False Signal
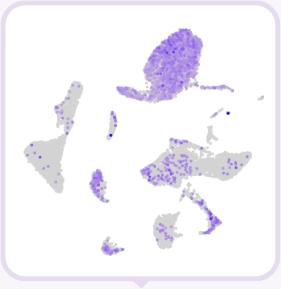
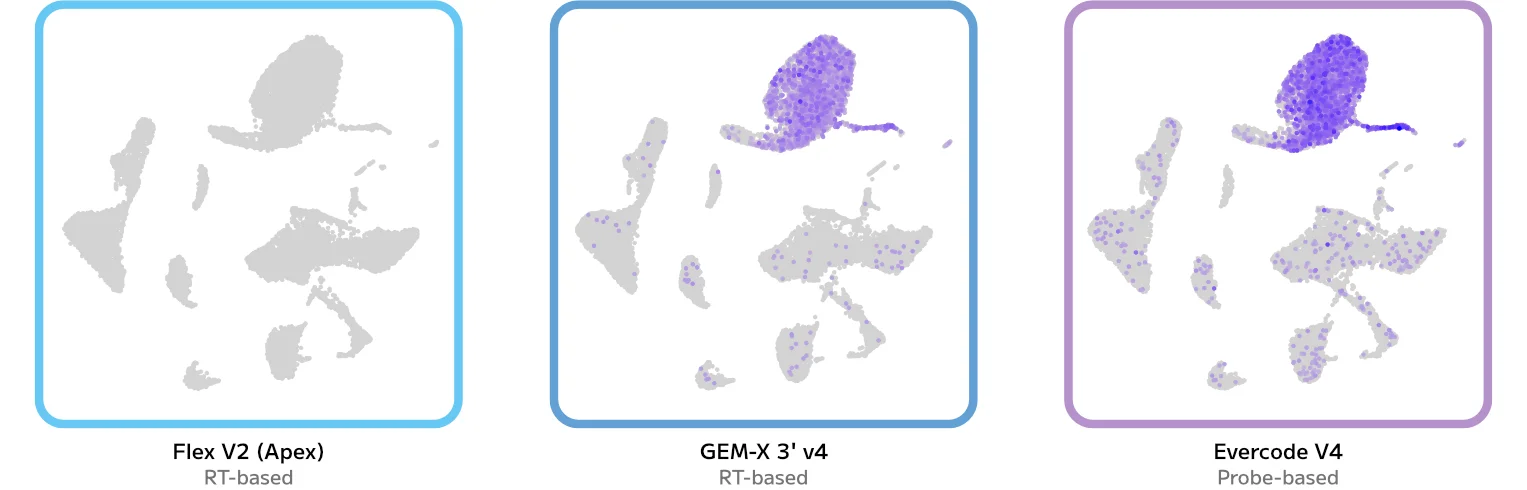
SRXN1 is one example of a potential false signal. In healthy PBMCs, SRXN1 signal appearing only in Flex could suggest oxidative stress, activation, or a disease-like cell state. Because SRXN1 has been linked to oxidative stress biology and cancer prognosis, this signal could appear biologically meaningful even when RT-based methods do not show the same pattern.
This is a Broader Pattern
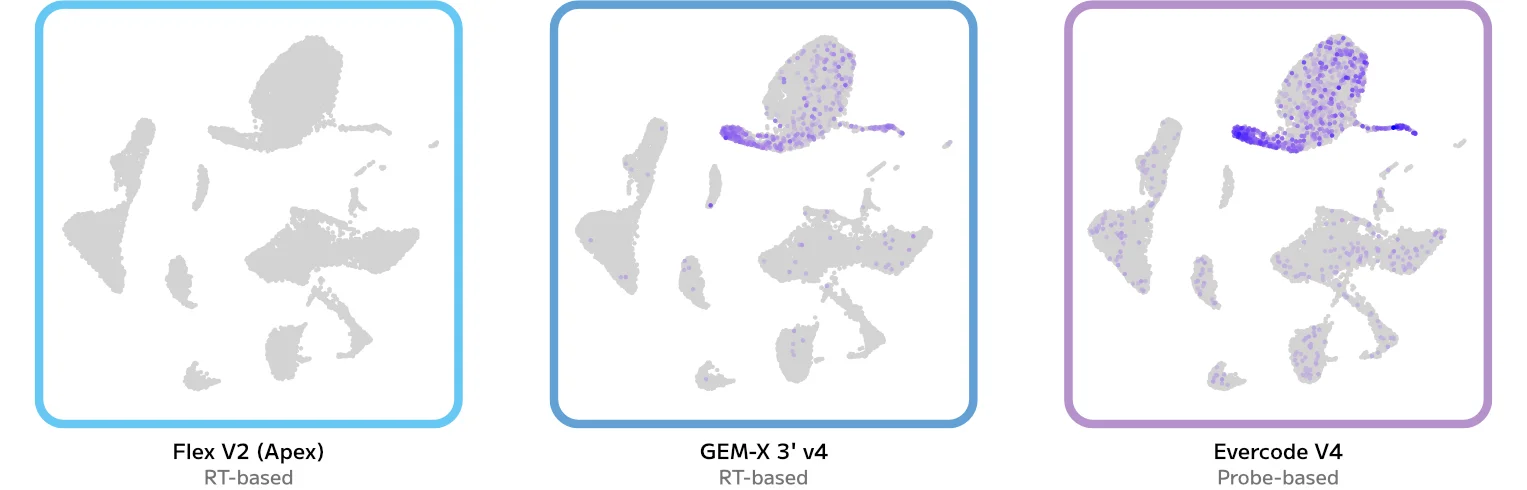
Probe-based measurement can change what appears present, absent, or differentially expressed. That matters because it means the issue is not limited to a single gene. It is a broader pattern that can shape how biology is seen and interpreted.
AMZ1
CACNA2D3
CCDC26
CR2
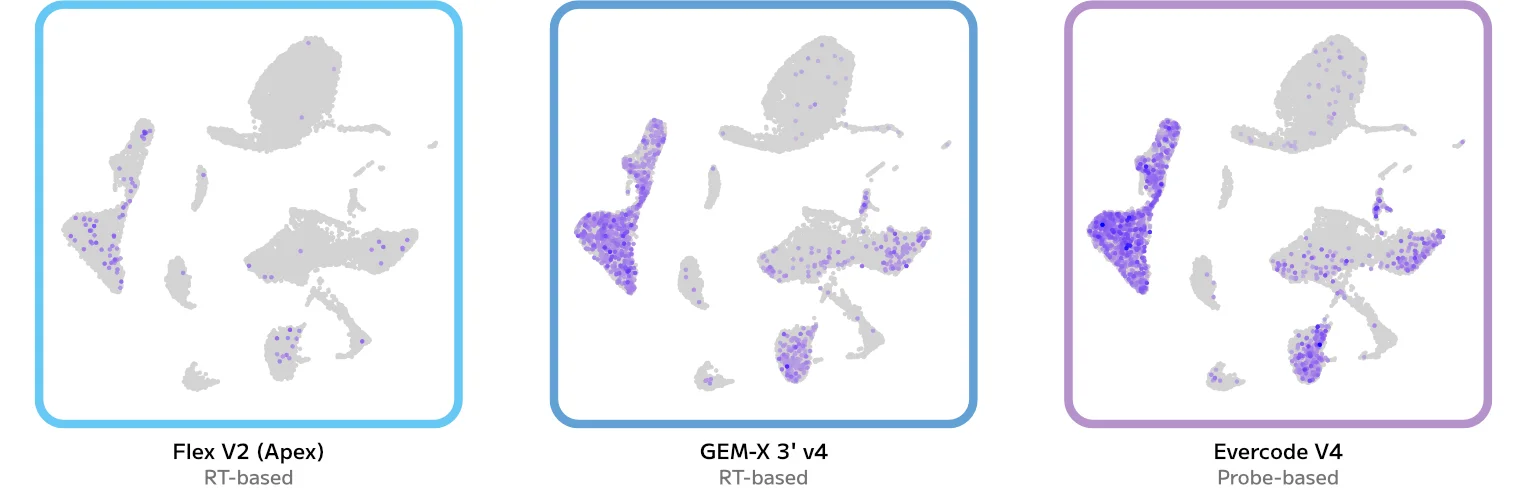
DAB1
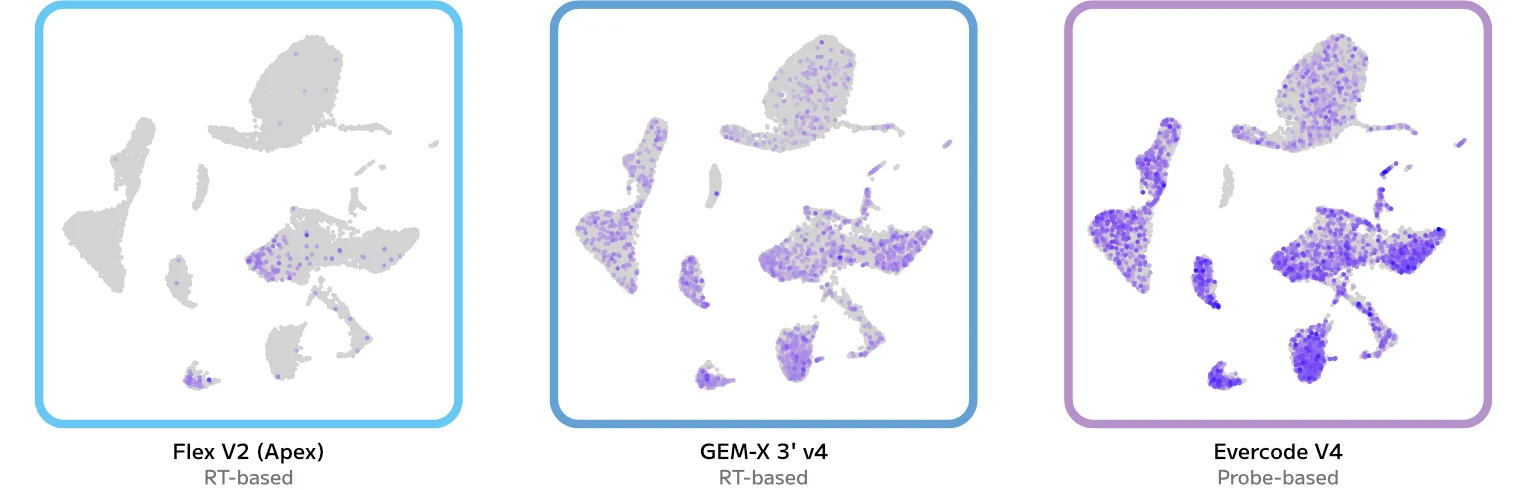
DOK6
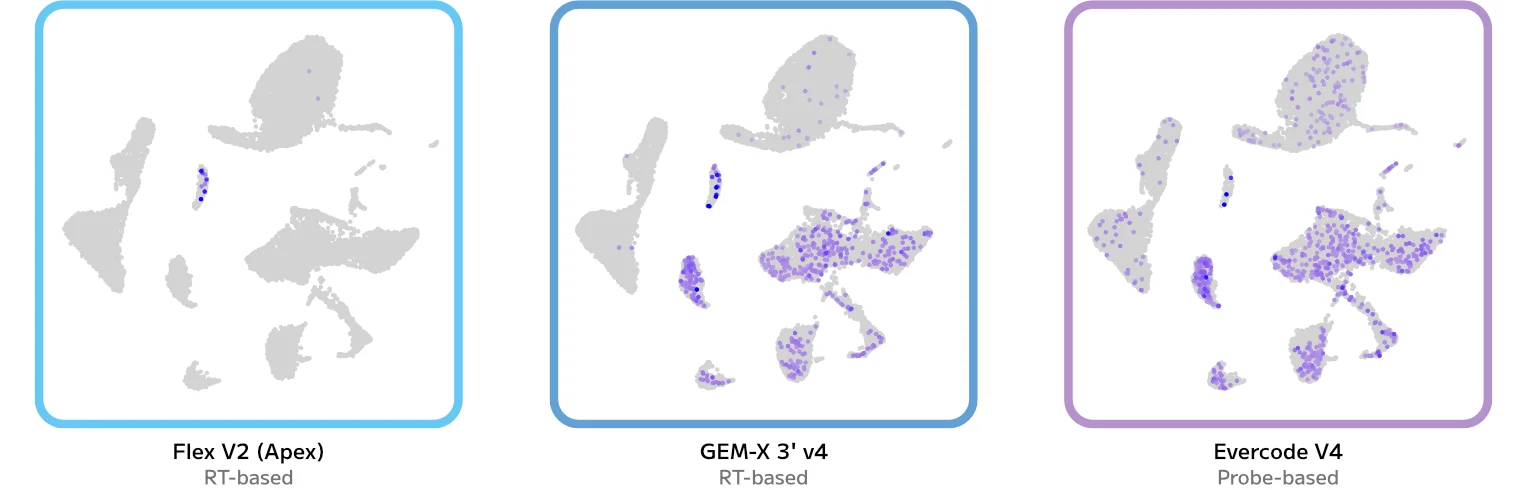
FTX
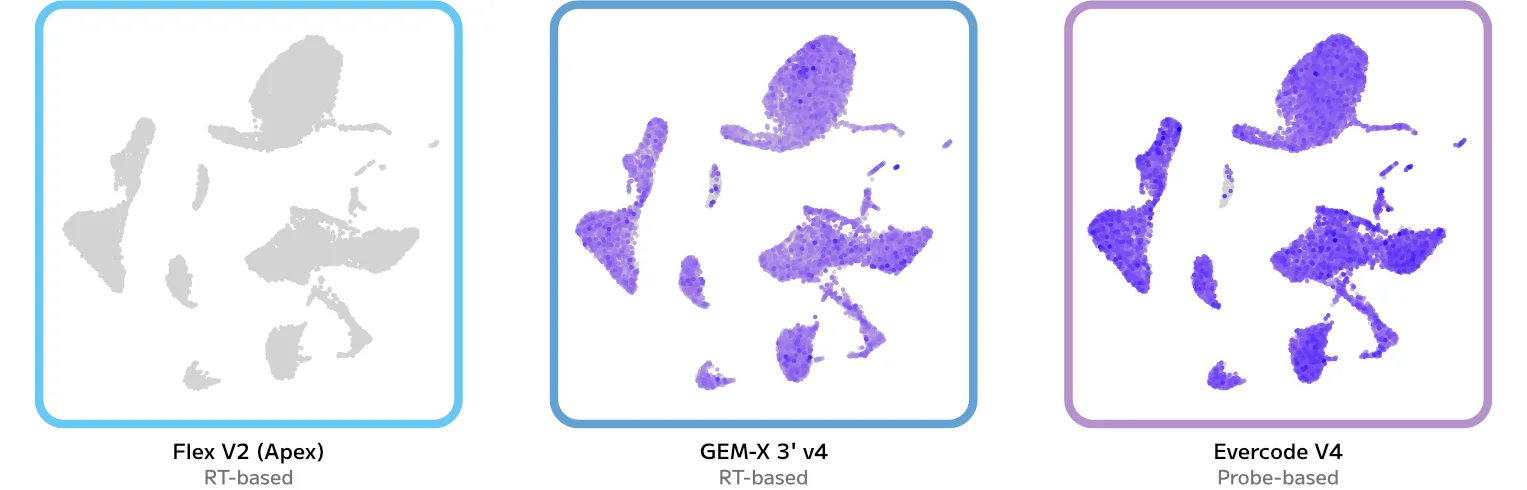
GPR137C
HECW2