

Comparison of Evercode™ Whole Transcriptome v3 kits in Human Immune Cells (PBMCs)
Key Takeaways
- Consistent gene detection across Evercode Whole Transcriptome v3 kits
- Recover the same cell type proportions regardless of scale
Evercode split-pool combinatorial barcoding technology enables single cell RNA-seq projects to scale exponentially without risking batch effects. To demonstrate the ease of scaling without sacrificing data quality, we compared the performance of Evercode WT Mini v3, Evercode WT v3, and Evercode WT Mega v3 with the same PBMC samples.
Experimental Design
Cryopreserved PBMCs from 4 donors were purchased from a commercial vendor. Vials were thawed in a 37༠C water bath, transferred to a 50 mL centrifuge tube, diluted dropwise with warm FBS media, centrifuged, and washed with cold FBS. All samples had a viability >90% after thawing. Samples were fixed with Evercode Cell Fixation v3 and frozen at -80༠C.
Fixed samples were processed with the respective Evercode WT Mini v3, Evercode WT v3, and Evercode WT Mega v3. For Evercode WT Mini v3, 500 cell and 5,000 cell sublibraries were created. For Evercode WT v3 and Evercode WT Mega v3, 500 cell and 12,500 cell sublibraries were created for each kit. Libraries were sequenced with an Illumina Nextseq 1000 P2 flow cell. After demultiplexing, sequencing data was processed with the Parse Biosciences data analysis pipeline v1.2.0. Data from the larger sublibraries was downsampled to an average of 20,000 reads/cell, downsampled to the same number of cells, integrated with Seurat, filtered to remove low quality cells, cell types classified with Azimuth, and annotations finalized manually.
Across all three kits, a similar number of genes were detected (Figure 1).
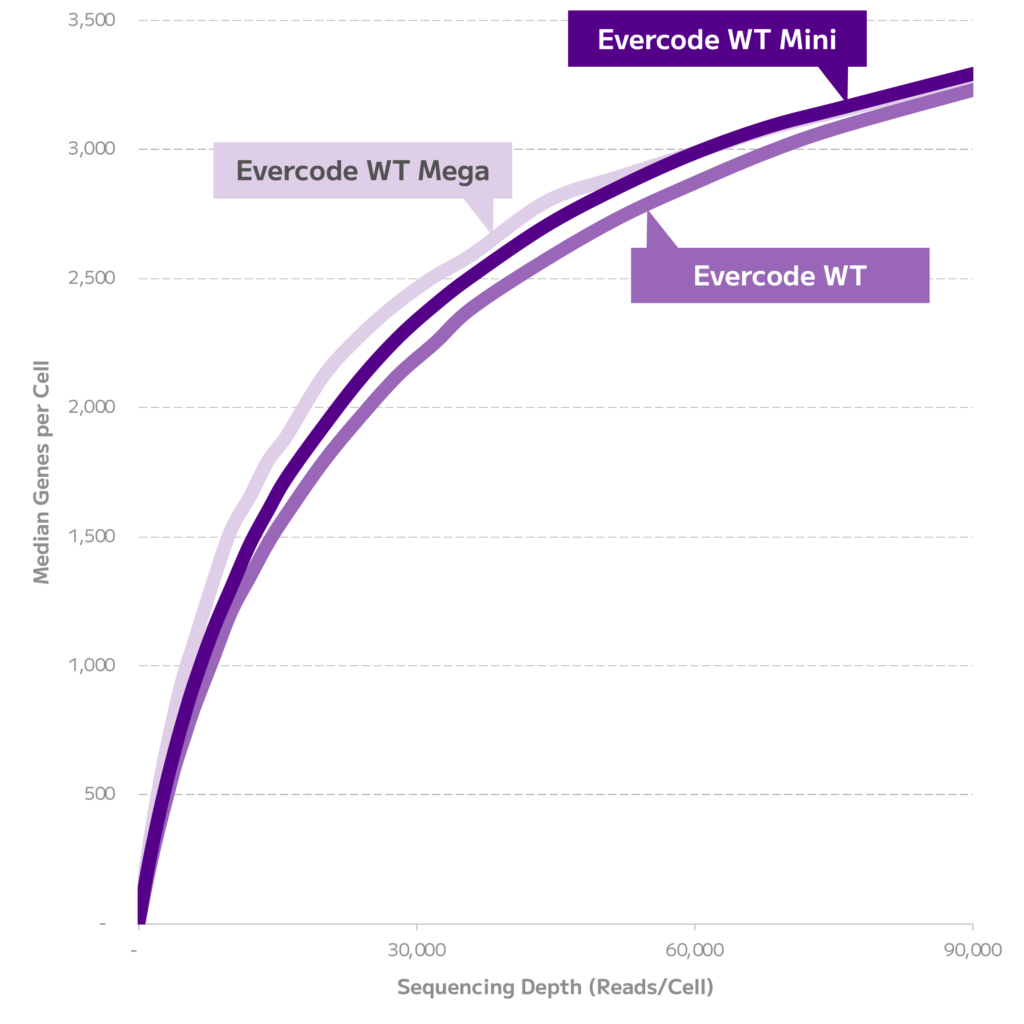
Figure 1. Gene Detection Sensitivity. Median genes detected per cell across different sequencing depths for each kit from the 500 cell sublibraries.
To enable a robust comparison, each dataset was downsampled to the same number of reads and cells. The data was then integrated, clustered, and annotated. The expected cell types were identified in nearly identical proportions across the three datasets, demonstrating equivalent performance across Evercode WT Mini v3, Evercode WT v3, and Evercode WT Mega v3 (Figure 2).
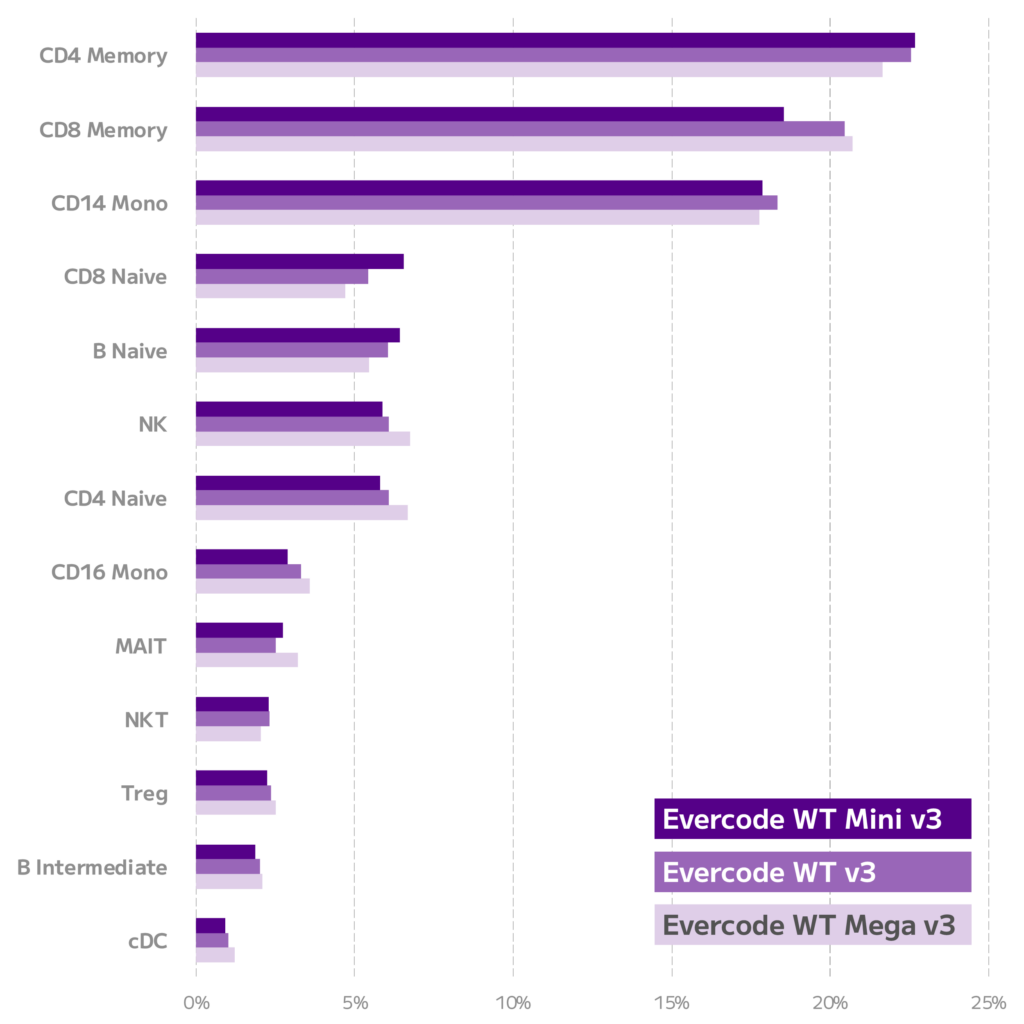
Figure 2. Equivalent Cell Type Proportions for Evercode Whole Transcriptome kits. Relative abundance of each cell type was quantified for Evercode WT Mini v3, Evercode WT, and Evercode WT Mega v3 datasets.
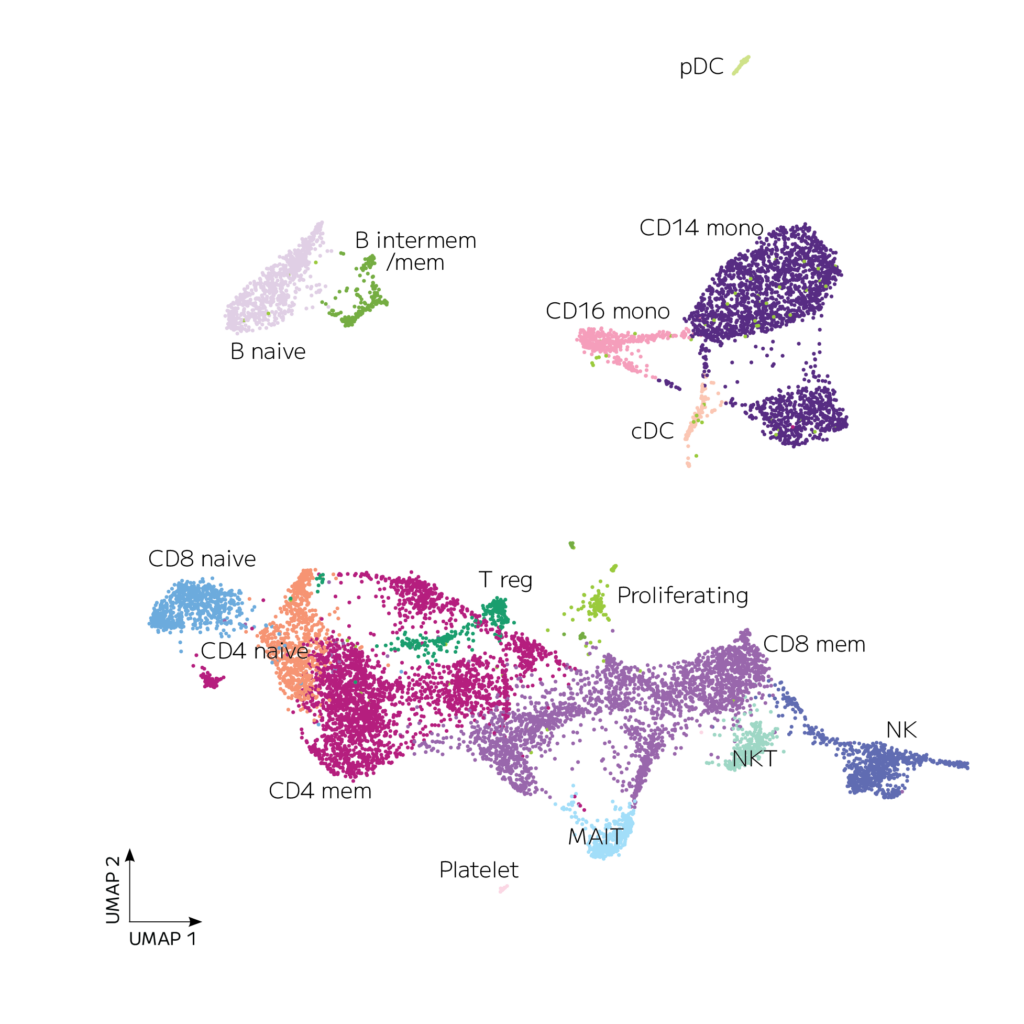
Figure 3. Integrated UMAP for three Evercode Whole Transcriptome datasets (Evercode WT Mini v3, Evercode WT v3, Evercode WT Mega v3). Data from each kit was integrate, clustered with Seurat, and annotated.
Downloads
We're your partners in single cell
Reach out for a quote or for help planning your next experiment.